The graphs below illustrate the gadgets individuals in the 18 to 25 age categories utilize to watch TV channels in Canada in 2009 and 2019.

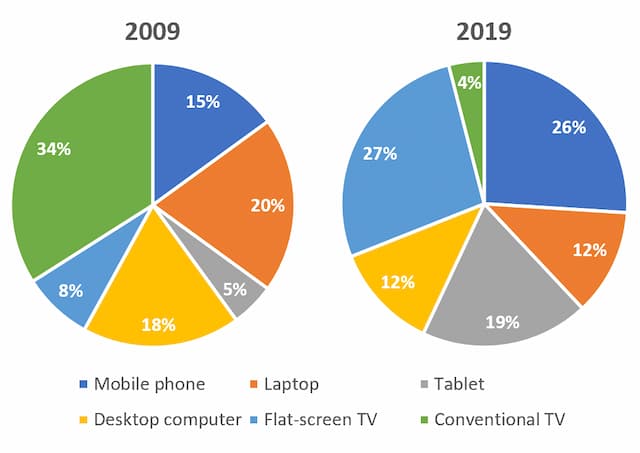
The two pie charts show the gadgets people in the 18 to 25 age categories utilized to watch TV channels between 2009 and 2019 in Canada.
Overall
, it is clear that
conventional TV channels had a huge dropped over time.
It is possible to identify significant features which are presented in the graph. First,
the highest watching rate was for conventional and laptops between 34% and 20%. However
, in 2019, the highest percentage was for flat-screen TVs and mobile phones almost the same rate 27% and 26%
It is surprising that tablets were the lowest number of gadgets individuals used to utilize in 2009 but in 2019 it had a significant increase of about 19%.
There are a number of comparisons that can be made according to
the data. Desktop computers were popular according to
the two graphs the rate was around 18%- 12%. Another comparison is for tablets, which were the least popular only 5%. However
, a few years later tablets had an extreme raise of about 19%.Submitted by shxxx2003 on
Unauthorized use and/or duplication of this material without express and written permission from this site’s author and/or owner is strictly prohibited. Excerpts and links may be used, provided that full and clear credit is given to Writing9 with appropriate and specific direction to the original content.
Linking words: Don't use the same linking words: "according to, however".
▼
Vocabulary: Rephrase the word "undefined" in your introduction.
▼
Vocabulary: The word "graph" was used 2 times.
▼
Vocabulary: The word "comparisons" was used 2 times.
▼
Vocabulary: The word "number of" was used 2 times.
▼
Vocabulary: The word "about" was used 2 times.
▼
Vocabulary: The word "significant" was used 2 times.
▼