The graph shows data about the annual earnings of three bakeries in Calgary, 2000-2010. Summarise the information by selecting and reporting the main features, and make comparisons where relevant.

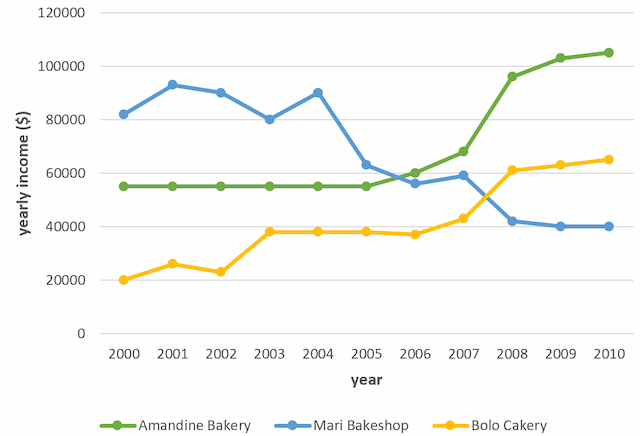
The line graph illustrates the every year income of three bakeries in Calgary between 2000 and 2010. Units are measured in dollars.
In general, what could
be
stand out from the graph is that Amandine's bakery's earnings remained stable from 2000 to 2005 and experienced a sharp increase during the Unnecessary verb
apply
last
five years. Another interesting point is the amount of money that was earned by Mari Bakeshop decreased over the given period.
Looking at the details, as regards Bolo Bakery, it can be clearly seen that its incomes experienced a significant rise, remained stable at 40.000$ over 3 years and reached a peak at approximately to
60.000$. If we look at Amandine's bakery, it remained constant during the first five years of the observed period and soared. Change preposition
apply
By contrast
, during the observed decade, it could be highlighted that Mari Bakeshop's earnings decreased twice, from 80000$ in 2000 to 40000 in 2010.Submitted by gulnara.7676 on
Unauthorized use and/or duplication of this material without express and written permission from this site’s author and/or owner is strictly prohibited. Excerpts and links may be used, provided that full and clear credit is given to Writing9 with appropriate and specific direction to the original content.
Vocabulary: The word "graph" was used 2 times.
▼
Vocabulary: The word "decreased" was used 2 times.
▼
Vocabulary: The word "remained" was used 3 times.
▼
Vocabulary: The word "stable" was used 2 times.
▼