The chart below gives information on the percentage of British people giving money to charity

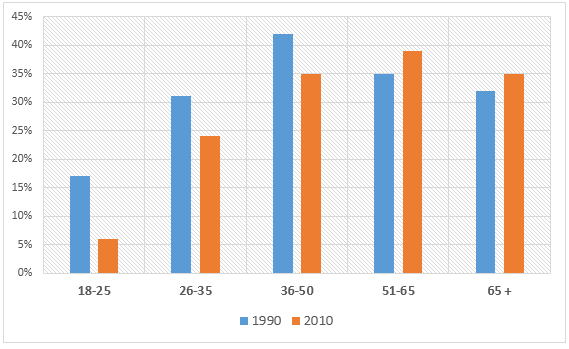
The bar chart demonstrates the proportion of citizens of different youth groups varying from 18 to over 65 in Britain who donated funds to charity between 1990 to 2010
Overall
, we can see that the middle youth group donated more money at the beginning than the elder groups, whereas
the adults were 3 times more generous at the start compared to the end.
According to
the chart, the old age group of 26-35 presents 31% in 1990 after 20 years it changed to 24% dipping by 7% as opposed to the higher life group of 51-65 which was 35% in 1990 but it increased to 39% in 2010 and represented the highest figure on that year. While
36-50 was at the peak number in 1990 making it 42% and then
it fell marginally to 35% as it comes to the oldest category of people who are over 65 in 1990 the figure was 32% but during 2 decades it rose slightly to 35%.
Lastly
, although
adolescents between 18-25 years contributed 16% in 1990, it plunged to 7% at the end
of the period.Submitted by Abdu.abetayev on
Unauthorized use and/or duplication of this material without express and written permission from this site’s author and/or owner is strictly prohibited. Excerpts and links may be used, provided that full and clear credit is given to Writing9 with appropriate and specific direction to the original content.
Sentences: Add more complex sentences.
▼
Introduction: The introduction is missing.
▼
Introduction: Change the first sentence in the introduction.
▼
Introduction: The chart intro is missing.
▼
Introduction: The chart intro is missing.
▼
Vocabulary: The word "chart" was used 2 times.
▼
Vocabulary: The word "figure" was used 2 times.
▼