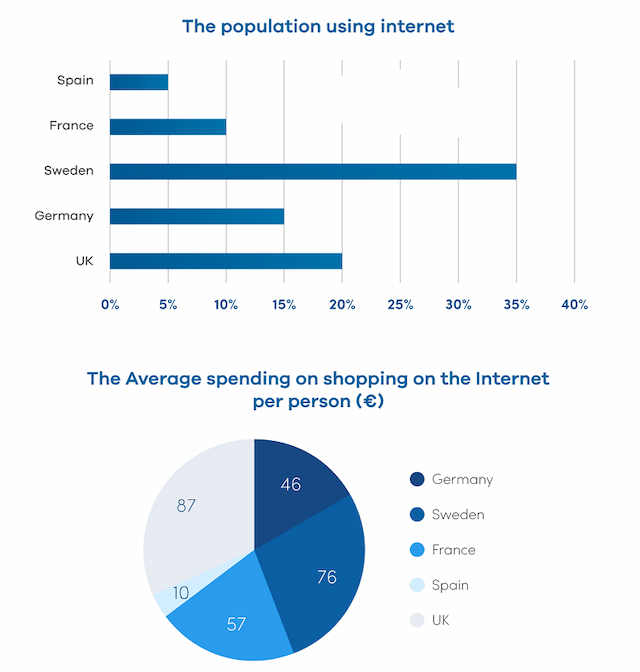
The charts show the info about the use of Internet in five countries in Europe in 2000.

the bar graph illustrates the proportion of
internet
users
in 5 nations in Europe in the year 2000, whereas
the pie chart compares the average spending on online shopping in the aforementioned countries.
overall
, while
the percentage of Sweden's internet
users
was highest in the surveyed year, the figure for Spain was far lower. remarkably, the UK spent a huge amount of money shopping on the Internet
.
with regards to the first graph, the proportion of the population using the Internet
hit its peak of 35%, followed by the category of the UK, accounting for 20%. the figure for Germany and France's internet
users
reached 15% and 10%, respectively. the percentage of Spain's users
of the Internet
bottomed at 5% in the given year.
in terms of the pie chart, over 85 pounds
was expended by the UK's population on online shopping, whilst Spain people only spent 10 pounds
on this
type of shopping. meanwhile, in France, shopping on the Internet
made up 57 pounds
in comparison with 46 pounds
in Germany. the expenditure on online shopping in Sweden took up nearly 80 pounds
in 2000.Submitted by bobong120906 on
Unauthorized use and/or duplication of this material without express and written permission from this site’s author and/or owner is strictly prohibited. Excerpts and links may be used, provided that full and clear credit is given to Writing9 with appropriate and specific direction to the original content.
Vocabulary: Replace the words internet, users, pounds with synonyms.
▼
Vocabulary: The word "chart" was used 2 times.
▼
Vocabulary: The word "graph" was used 2 times.
▼
Vocabulary: The word "figure" was used 2 times.
▼
Vocabulary: The word "percentage" was used 2 times.
▼
Vocabulary: The word "proportion" was used 2 times.
▼