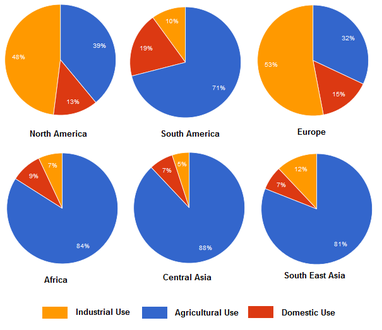
The chart below shows the percentage of water used for different purposes in six areas of the world.

The given chart depicts the proportion of
water
used for various intents such
as Industrial, Agriculture, and domestic use
in North America
, South America
, Europe
, Africa, Central Asia
, and South East Asia
.
Overall
, water
use
in Agriculture in six
countries
is the highest, and Central Asia
is number one among the six
countries
. Europe
is the highest use
of water
for industrial use
and the lowest in Central Asia
. Domestic use
of water
in six
countries
is the lowest than other purposes.
To begin
with, South America
, Africa, Central Asia
, and South East Asia
use
water
for agricultural purposes above 70%. North America
and Europe
use
water
for crops under 40%. Industrial use
in North America
and Europe
is above 45%. In contrast
, South America
, Africa, Central Asia
, and South East Asia
use
under 15%. In six
countries
, domestic water
use
varies, but the percentage is under 20%, lowest than other intents.Submitted by ieltscuns2022 on
Unauthorized use and/or duplication of this material without express and written permission from this site’s author and/or owner is strictly prohibited. Excerpts and links may be used, provided that full and clear credit is given to Writing9 with appropriate and specific direction to the original content.
Sentences: Add more complex sentences.
▼
Vocabulary: Replace the words water, use, america, europe, asia, six, countries with synonyms.
▼
Vocabulary: Only 5 basic words for charts were used.
▼
Vocabulary: Use several vocabularies to present the data in the second paragraph.
▼