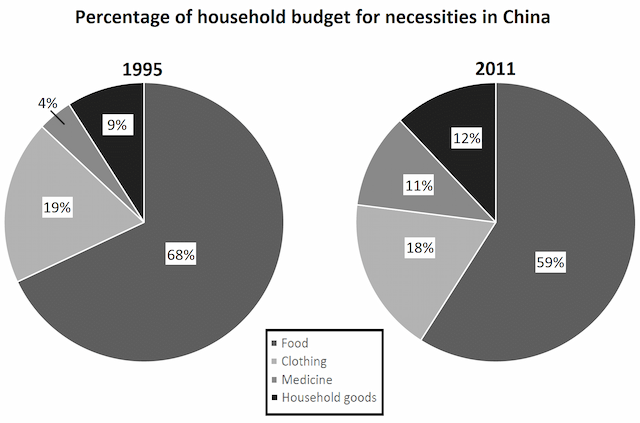
The chart below gives information about the household percentage of spending on essential goods in China for the years 1995 and 2011

The twin pie charts illustrate the expense of
household
necessities in China in the year 1995 along with
2011. This
is based on four parameters namely food, clothing, medicine and household
goods.
The budget for food is highest in 1995 at sixty-eight per cent
, whereas
the expenditure on medicine is the lowest at four per cent
only. Though significantly less, edible is followed by clothing with an allocation of only nineteen per cent
, while
nine per cent
is the allocation to other household
goods.
This
budget has undergone notable changes over sixteen years. In 2011, the expense of meals was minimised by nine per cent
and it became fifty-nine per cent
, but on ,medicines it hiked by seven per cent
. The new expenditure on medicine is eleven per cent
of the total expense. The budget for clothing remained almost the same i.e., 19%, however
for other household
goods it rose by three per cent
and became 12%.Submitted by anupriyahalder on
Unauthorized use and/or duplication of this material without express and written permission from this site’s author and/or owner is strictly prohibited. Excerpts and links may be used, provided that full and clear credit is given to Writing9 with appropriate and specific direction to the original content.
Vocabulary: Replace the words household, cent with synonyms.
▼
Vocabulary: Only 6 basic words for charts were used.
▼