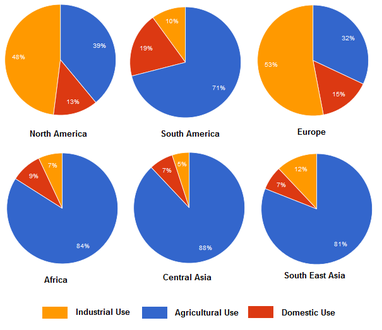
The charts below show the percentage of water u sed for different purposes in six areas of the world.

The following charts illustrate the percentage of
water
used for 3 different purposes in six different areas of the world.
Overall
, it has three different used water
areas such
as industrial, agricultural, and domestic. The maximum used areas are industrial in four countries apart from North America and Europe.
To begin
with, In the industrial area, the maximum used water
is Central Asia with 88% and the second and third place are in order Africa and Southeast Asia with 84% and 81%. The next country is South America with 77%. The minimum used water
is 39% and 32% in order by North America and Europe.
InSubmitted by Niyoshakhalili on
Unauthorized use and/or duplication of this material without express and written permission from this site’s author and/or owner is strictly prohibited. Excerpts and links may be used, provided that full and clear credit is given to Writing9 with appropriate and specific direction to the original content.
Sentences: Add more complex sentences.
▼
Common mistake: Your writing should be 150-250 words.
Basic structure: Change the third paragraph.
▼
Vocabulary: Rephrase your introduction. Words match: 78%.
▼
Vocabulary: Replace the words water with synonyms.
▼
Vocabulary: Rephrase the word "percentage" in your introduction.
▼
Vocabulary: Only 3 basic words for charts were used.
▼
Vocabulary: Use several vocabularies to present the data in the second paragraph.
▼
Vocabulary: Use several vocabularies to present the data in the third paragraph.
▼
Vocabulary: Use several vocabularies to present the data in the fourth paragraph.
▼