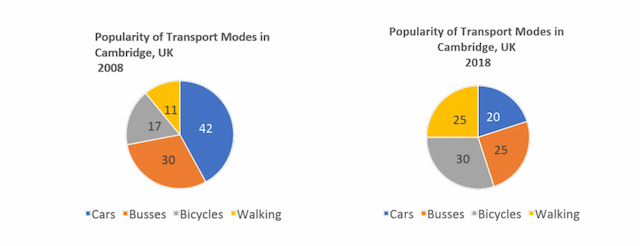
The charts below provide information on popular modes of transport in the city of Cambridge for the years 2008 and 2018.

The pie charts below illustrate the large percentage of them. Interestingly, both years
number
of transport
modes which are divided into 4 categories; cars, busses
, bicycles
, and walking. In 2008 and 2018 it is located in the capital of Cambridge.
Overall
, it can be clearly observed that the majority of car users was the highest percentage in 2008. In contrast
, for the year 2018, the number
of bicycles
wasAdd an article
a
the
busses
and bicycles
transport
maintain the same number
.
Starting with, Transport
modes in Cambridge, Uk in 2008, at 42 ratio
of cars accounted for the huge usage and followed by Change to a plural noun
ratios
busses
at 30, and bicycles
at 17, respectively. The walking method was taken as the lowest number
at 11 per cent
.
With regard to, 10 years later in 2018, the information of
Change preposition
on
transport
modes was changed modestly. However
, bicycles
were the large proportion at 30 per cent
. On the other hand
, cars experienced the lowest point at 20 per cent
. Interestingly, both walking and busses
represented the same proportion at 25 per cent
.Submitted by nuchnapa.anna on
Unauthorized use and/or duplication of this material without express and written permission from this site’s author and/or owner is strictly prohibited. Excerpts and links may be used, provided that full and clear credit is given to Writing9 with appropriate and specific direction to the original content.
Vocabulary: Replace the words number, transport, busses, bicycles, cent with synonyms.
▼
Vocabulary: The word "number of" was used 2 times.
▼
Vocabulary: The word "percentage" was used 2 times.
▼
Vocabulary: The word "proportion" was used 2 times.
▼