The chart below shows the changes that took place in three different areas of crime in Newport

This
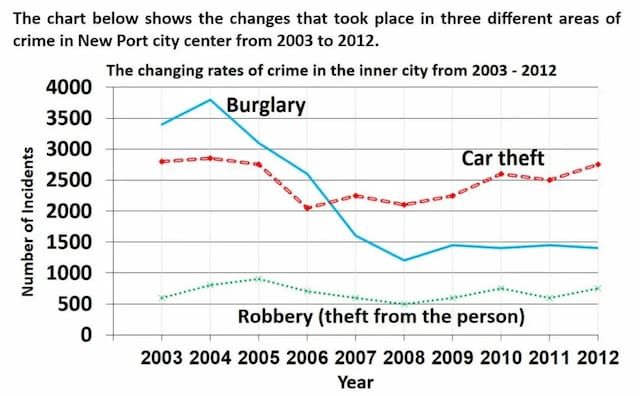
chart represents information about crimes that occurred in three different areas of illegal activities in Newport City between 2003 and 2008.
Overall
, it is clear that
at the beginning burglary and car
theft were close but in 2007 car
theft overtook the number of burglaries.
Firstly
, if we look at burglary it was the most popular crime and reached its peak in 2004 achieving 3700 incidents. Then
the next year it experienced a downward trend until 2008 when it hit a trough of 1200 occasions. Nonetheless
surging for over 4 years there was an upward trend by the end of the period in question.
Secondly
, according to
the data from the chart episodes of car
thefts decreased after 2005 making it 2100. Then
it was stable changing only a little bit. From 2009 it grew little and by the end of ,2012 it was near to the original 2700. Last
but not least there is a robbery that was changing throughout the era. This
sort of crime was not even close to burglary and car
theft. It reached its peak in 2005 with a total of 800 incidents.
Then
after three years
it reached the lowest point of 500 crime episodes and Add a comma
,years
then
finally
for the rest of it was stable only with little changes.Submitted by Abdu.abetayev on
Unauthorized use and/or duplication of this material without express and written permission from this site’s author and/or owner is strictly prohibited. Excerpts and links may be used, provided that full and clear credit is given to Writing9 with appropriate and specific direction to the original content.
Vocabulary: Replace the words car with synonyms.
▼
Vocabulary: The word "chart" was used 2 times.
▼
Vocabulary: The word "trend" was used 2 times.
▼
Vocabulary: The word "reached" was used 3 times.
▼
Vocabulary: The word "stable" was used 2 times.
▼