The table shows the Proportions of Pupils Attending Four Secondary School Types Between 2000 and 2009

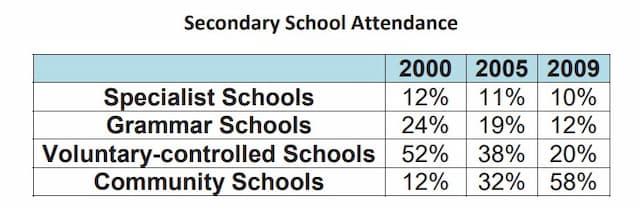
The table illustrates the percentage of students'
attendance
in four types of secondary schools
between 2000 and 2009.
It is clear that
the attendance
rate of students in voluntary schools
, grammar schools
and specialist schools
declined throughout the period. While
community schools
had the highest rate of attendance
.
Looking into more detail, in 2000, voluntary schools
reached an attendance
rate of 52%, which was the highest compared to other schools
in that period. By 2009 the number of pupils reached its lowest at 20%. However
, in that same period, Community School attendance
jumped from 12% in 2000 to 30% in 2005, reaching 58% by 2009
In 2000, the Grammar Schools
' presence record placed the second highest at 24%s but suffered a significant decline reaching 12% in 2009. Meanwhile, specialist schools
faced a steady decrease percentage of 1% each yearSubmitted by ihanenn1 on
Unauthorized use and/or duplication of this material without express and written permission from this site’s author and/or owner is strictly prohibited. Excerpts and links may be used, provided that full and clear credit is given to Writing9 with appropriate and specific direction to the original content.
Sentences: Add more complex sentences.
▼
Common mistake: Your writing should be 150-250 words.
Vocabulary: Replace the words attendance, schools with synonyms.
▼
Vocabulary: The word "percentage" was used 2 times.
▼
Vocabulary: The word "declined" was used 2 times.
▼
Vocabulary: The word "reached" was used 2 times.
▼