The chart below gives information about the household percentage of spending on essential goods in China for the years 1995 and 2011

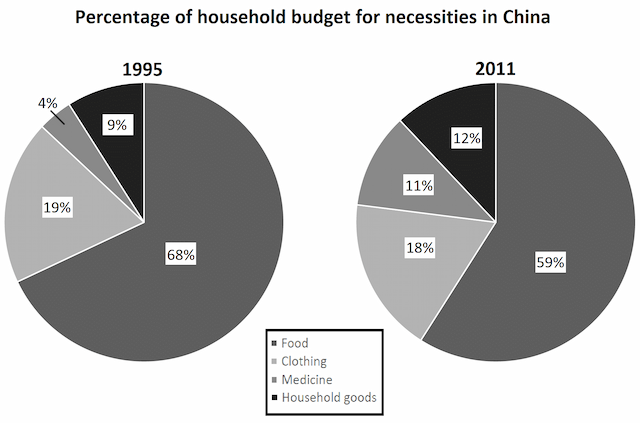
The pie charts compare the proportion of the domestic budget for the important product in China in the years 1995 and 2011.
Overall
, it is evident that food and clothing consume the largest size of household
expenses while
household
goods
and medicine
were the least significant categories also
whereas
the expenses on food and clothing decreased, medicine
and household
goods
spending rose.
To begin
, food was by far the most essential item for the residents of China. In 1995 it accounted for more than half (68%) of the entire expenses,it dropped to 59% in 2011 but still remains the most important group. The second item that received more recognition was clothing attracting 19% of the household
's money in 1995 which declined by 1% in 2011.
In contrast
medicine
and household
goods
were the least vital on the items list in Chinese. In 1995 they spent just 4% of their domestic resources on medicine
which was by far the lowest fund spent and 9% on household
goods
. By 2011 both sectors grew in importance and recorded a rate slightly higher than a tenth each.Submitted by yeboahsamuellaabban on
Unauthorized use and/or duplication of this material without express and written permission from this site’s author and/or owner is strictly prohibited. Excerpts and links may be used, provided that full and clear credit is given to Writing9 with appropriate and specific direction to the original content.
Sentences: Add more complex sentences.
▼
Vocabulary: Replace the words household, goods, medicine with synonyms.
▼