The chart below gives information about the household percentage of spending on essential goods in China for the years 1995 and 2011

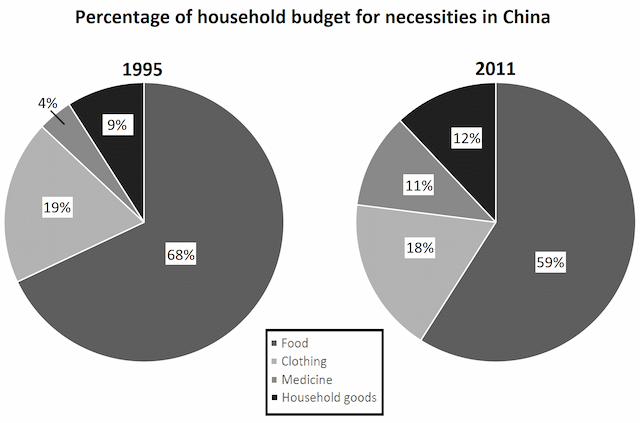
The pie chart shows money expenditure on basic necessities
such
as Food, clothing, medicine and household goods in Chinese country during the 2 years (1995 and 2011)
Overall
, it can be seen that household goods accounted for the majority of the budget percentage earlier in 1995, while
nutrient demands accounted for the least in the same year.
In detail, household products provided the most of the spending, at 68%. Similarly
, category
had been provided within 16 years later with the only difference of 9%. The other sectors were much smaller. Clothing, which was the second largest expenditure, brought in 19% during the 1995 year, and Add an article
the category
this
was followed by food, at 9%. The least spending was on medicine, accounting for only 4% combined.
There was the same picture in the past 2011 with the
very small differences among the three categories of food, clothing and medicine. The clothing and medical sector considering 11% and 12% respectively.Correct article usage
apply
Submitted by alfiyaa.mustafina on
Unauthorized use and/or duplication of this material without express and written permission from this site’s author and/or owner is strictly prohibited. Excerpts and links may be used, provided that full and clear credit is given to Writing9 with appropriate and specific direction to the original content.
Vocabulary: Only 5 basic words for charts were used.
▼
Vocabulary: The word "provided" was used 2 times.
▼
Vocabulary: The word "difference" was used 2 times.
▼