The graph and chart below give information on the average daily maximum and minimum temperatures in degrees Celsius (°C) and the average number of days with rainfall each month for two Australian cities. Write a report for a university, lecturer describing the information shown below. Summarise the information by selecting and reporting the main features and make comparisons where relevant.

#information #temperatures #degrees #celsius #°c #rainfall #month #two #australian #cities #report #university #lecturer #summarise #features #comparisons
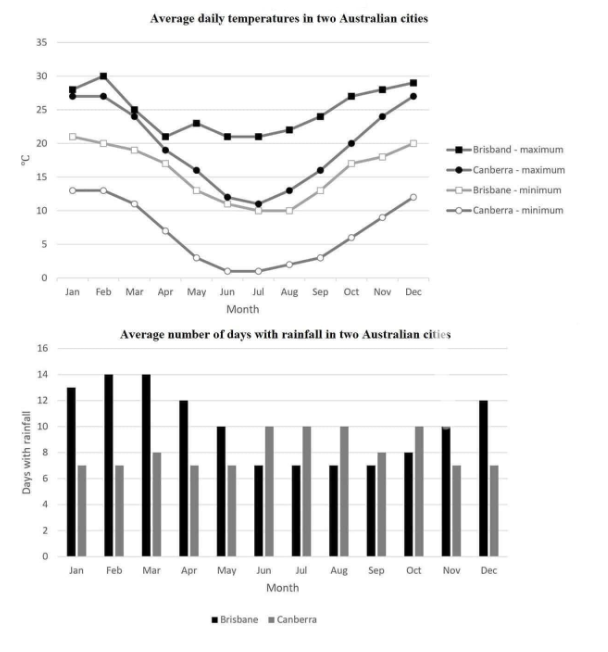
The line graph shows the daily amplitude temperature in two Australian cities, Brisbane and Canberra. Meanwhile, in the other graph, we may appreciate the number of rainy
days
in each month in both cities as well.
Overall
, we may infer each city experiments different
precipitation regimes, depending on the season they are in. In Brisbane, during the summer season, rainy Change preposition
with different
days
increase, while
in Canberra this
tendency seems to be turnback.
A closer look at Brisbane shows us that during the months of January, February, and March the daily amplitude is minimum, variating between 1°C
to 5°C
, and there is a high level of rainy days
in each month, between 13 to 14 days
. On the other hand
, Canberra has a more significant growth in its daily amplitude during the entire year, achieving a variation between 15°C
to 20°C
during the winter season, where the rainy days
in these months are máximun, variating between 10 to 5.Submitted by mguadagni on
Unauthorized use and/or duplication of this material without express and written permission from this site’s author and/or owner is strictly prohibited. Excerpts and links may be used, provided that full and clear credit is given to Writing9 with appropriate and specific direction to the original content.
Sentences: Add more complex sentences.
▼
Vocabulary: Replace the words days, °c with synonyms.
▼
Vocabulary: Only 6 basic words for charts were used.
▼
Vocabulary: The word "graph" was used 2 times.
▼
Vocabulary: The word "shows" was used 2 times.
▼