The chart below gives information about the household percentage of spending on essential goods in China for the years 1995 and 2011

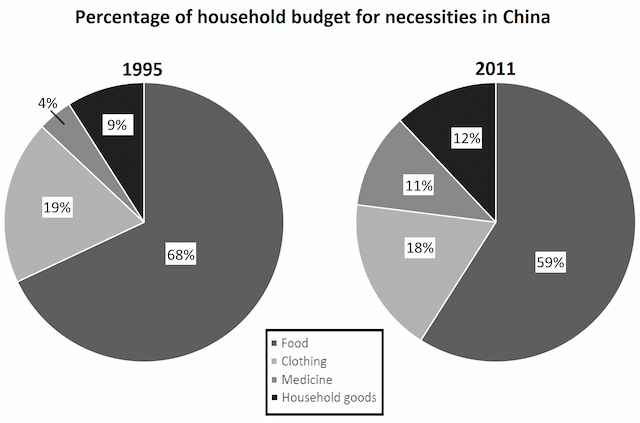
The pie chart illustrates data about the proportion of Chinese people's expenditure on four fundamental items, including food, clothing, medicine and household goods,
this
was conducted in two different years 1995 and 2011.
At first glance, it is recognizable that overall
, the highest percentage of the budget went to food in both reporting periods, whereas
the lowest rate was spent on pharmaceutical drugs.
Looking at the graph in more detail, it is clear that
more than 68% of citizens' money in China was consumed in nutrition in 1995, however
, a slight decline in this
expenditure by 9% was observed after 16 years. Interestingly, the amount of their spending on purchasing new outfits was almost similar in two years, and it was the second highest number, and it is followed by house products and medication. At the end
of the 20th century, the rate of their money on the former accounted for 9%, whilst medicine took only 4% of the total expense. Nonetheless
, after a decade and a half, Chinese spending on merchandise gradually climbed up, till it reached 11%, in the meantime, the rate of their funds consumed on medicament was approximately multiplied by 3 times.Submitted by anislom26 on
Unauthorized use and/or duplication of this material without express and written permission from this site’s author and/or owner is strictly prohibited. Excerpts and links may be used, provided that full and clear credit is given to Writing9 with appropriate and specific direction to the original content.