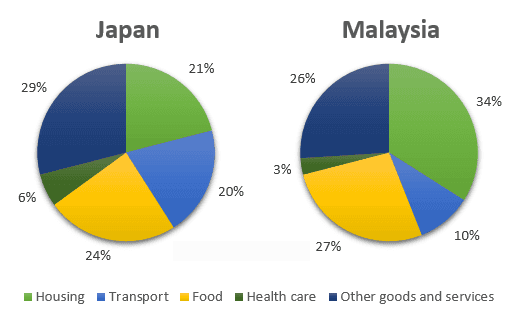
The pie charts below show the average household expenditures in Japan and Malaysia in the year 2010.

The two pie charts illustrate the proportion of money spent on
Add an article
the household
a household
household
in Fix the agreement mistake
households
Japan
compare to Malaysia
in 2010 in terms of five important categories namely- housing, transport, food, health care, other
goods and services.
In general, it can be seen that Japanese and Malaysian Correct word choice
and other
citizen
spent the most percentage of their budget on just three household expenses namely housing, food and other goods and services. Fix the agreement mistake
citizens
Moreover
, the payments of these countries spent the least on health care and transport.
It can be clearly seen from the chart, in Malaysia
the greatest proportion of expenditure (34%) was on housing, Add a comma
,Malaysia
while
in Japan
housing accounted for just 21% of the total. Followed by in Japan
the greatest single expense was other goods and services at 29%, compared with 26% in Malaysia
. Moreover
, in term
of Fix the agreement mistake
terms
the
food, the percentage of expenditures for both nations were relatively similar, at 27% Correct article usage
apply
of
Change preposition
for
Malaysia
and 24% for japan
.
In both countries, the smallest proportion of spending was on health care. In Correct your spelling
Japan
Malaysia
, this
accounted for 3% of the total household expenses, while
the figure for transport represented 10%. These figures were exactly doubled in Japan
which were 6% and 20% respectively.
(197 words)Submitted by ssirirat on
Unauthorized use and/or duplication of this material without express and written permission from this site’s author and/or owner is strictly prohibited. Excerpts and links may be used, provided that full and clear credit is given to Writing9 with appropriate and specific direction to the original content.
Linking words: Don't use the same linking words: "moreover, while".
▼
Vocabulary: Replace the words japan, malaysia with synonyms.
▼
Vocabulary: The word "charts" was used 2 times.
▼
Vocabulary: The word "compare" was used 2 times.
▼
Vocabulary: The word "figure" was used 2 times.
▼
Vocabulary: The word "percentage" was used 2 times.
▼
Vocabulary: The word "proportion" was used 3 times.
▼
Vocabulary: Use several vocabularies to present the data in the fifth paragraph.
▼