The chart and graph below give information about sales and share prices for Coca-Cola. Write a report for a university lecturer describing the information shown below.

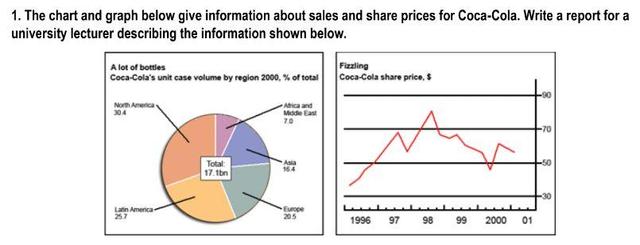
The given figures represent sales and share prices of Coca-cola. The volume of sales divided by region was presented in a pie
chart
, while
the share prices between 1996 and 2001 were displayed in a line chart
.
According to
the pie chart
, it can be seen that North America was the largest section, which is 30.4% ,whereas
Africa and the Middle East are the smallest part, which is 7%.
According to
the line chart
, it starts the period at the bottom of the graph,which just above 30, it was increased to nearly 50% and dropped down in the middle of the year 1997 and reach the peak of the graph in 1988 and it has
fluctuate and end the timeframe at above 50.
In conclusion, the information experienced Add the particle
tohas
fluctuate
Wrong verb form
fluctuating
trend
throughout the whole timeframe.Fix the agreement mistake
trends
Submitted by nuchnapa.anna on
Unauthorized use and/or duplication of this material without express and written permission from this site’s author and/or owner is strictly prohibited. Excerpts and links may be used, provided that full and clear credit is given to Writing9 with appropriate and specific direction to the original content.
Linking words: Don't use the same linking words: "according to".
▼
Common mistake: Your writing should be 150-250 words.
Vocabulary: Replace the words chart with synonyms.
▼
Vocabulary: Rephrase the word "give" in your introduction.
▼
Vocabulary: The word "chart" was used 4 times.
▼
Vocabulary: The word "fluctuate" was used 2 times.
▼