The pie charts and table give information about the total value and sources of fish imported to the US between 1988 and 2000.

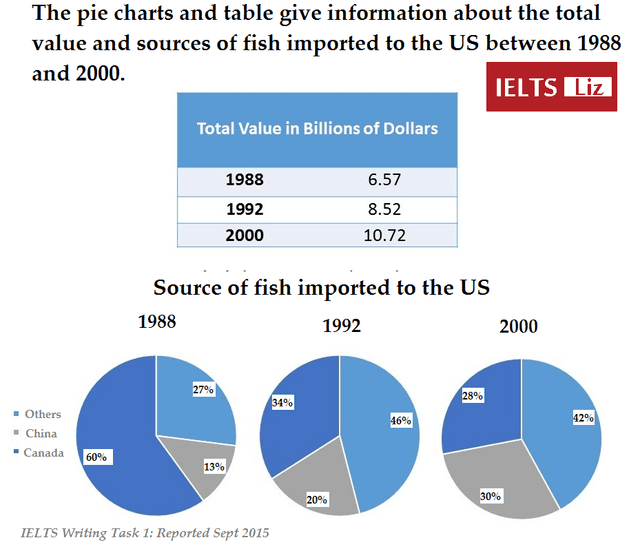
The table illustrates the total value between 1988 and 2000,
while
the pie charts compared types of export
to the US.
Overall
, the percentage of Canadian export
dropped by over half, in contrast
to the source of Chinese export
was account for a significant proportion end of the period. Meanwhile, the total value slightly increased over 13 years.
In the first year, the total price is exactly 6.57 billion dollars, the Canadian source of fish
export
compose of three-fifths while
Chinese fish
is just over 10%. After 5 years, the total value slightly increased by nearly 2 billion (8.52). Furthermore
, both countries’ imports generate over half a percent
.
In the third year, the total is more than 10 billion dollars, Canadian Change the spelling
per cent
fish
is little decreased by 28% as well as
Chinese export
is raised one in ten. In 1988, the other type of fish
accounted for 27% and then
, is
marginally increased before dropping by 3%.Correct your spelling
it
Submitted by gantulgaamarzaya6 on
Unauthorized use and/or duplication of this material without express and written permission from this site’s author and/or owner is strictly prohibited. Excerpts and links may be used, provided that full and clear credit is given to Writing9 with appropriate and specific direction to the original content.
Linking words: Don't use the same linking words: "while".
▼
Vocabulary: Replace the words export, fish with synonyms.
▼
Vocabulary: The word "increased" was used 3 times.
▼
Vocabulary: The word "slightly" was used 2 times.
▼