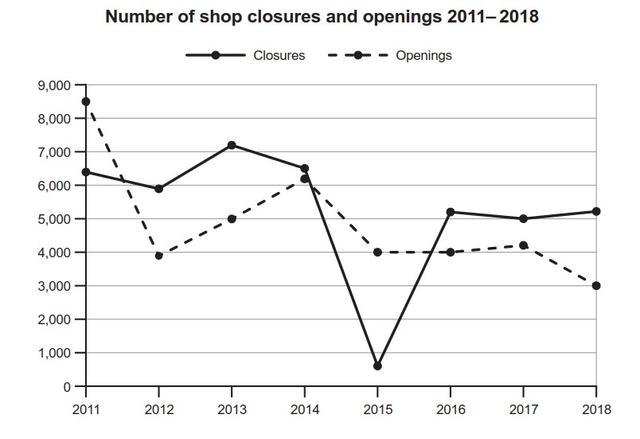
the graph below show the number of shops that closed and the number of new shops that opened in one country betweeb 2011 and 2018

The given line
graph
depicts some information about the number
of closures and openings of stores in the 7-year period
from 2011 to 2018.
Overall
as it
can be ostensibly seen, both the new Correct pronoun usage
apply
shops
and the closed ones' graph
experienced a dramatic decline over these 7 years, although
the number
of closures at the beginning of the period
is lower than the openings meanwhile there is a reverse effect at the end
of the period
.
The line graph
which is related to new stores, it
starts with 8500 numbers where there are 2000 more new Correct pronoun usage
apply
shops
compared to closed ones in 2011 while
after some fluctuation in this
period
there is the same 2000 amount but decreased from closures and reaches to 3000 Add a comma
,period
shops
in 2018.
In 2014 the number
of openings and closings are almost the same around the number
of 6000. the graph
witnesses the lowest amount of the
closed Correct article usage
apply
shops
during this
period
in the year 2015 around 500.Submitted by m.beirami2008 on
Unauthorized use and/or duplication of this material without express and written permission from this site’s author and/or owner is strictly prohibited. Excerpts and links may be used, provided that full and clear credit is given to Writing9 with appropriate and specific direction to the original content.
Vocabulary: Replace the words graph, number, period, shops with synonyms.
▼
Vocabulary: The word "graph" was used 4 times.
▼
Vocabulary: The word "amount" was used 2 times.
▼
Vocabulary: The word "number of" was used 4 times.
▼
Vocabulary: The word "around" was used 2 times.
▼