The chart below shows numbers of incidents and injuries per 100 million passenger miles travelled (PMT) by transportation type in 2002.

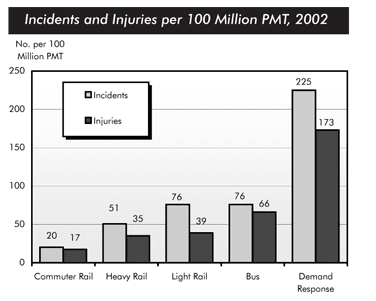
The bar graph gives information about how many
incidents
and injuries
occurred when using 5 different means of public transportation in the year 2002.
Overall
, most incidents
and injuries
took place on demand response vehicles. By contrast
, commuter rail
services recorded by far the lowest figures in 2002.
the total number of incidents
taking place on demand response transport services is higher than that of injuries
, with respective figures being 225 and 173. Dramatic differences were seen in the number of incidents
and those who were injured by using commuter rail
, which was
only 20 and 17 respectively. As for heavy Correct subject-verb agreement
were
rail
, there were 51 incidents
occurring in this
transport type, while
only 35 passengers got injuries
.
76 incidents
were recorded on both light rail
and bus services. There were 39 injured people using light rail
service, and these figures were nearly twice as low as those being bus users.Submitted by dangvinhphu97 on
Unauthorized use and/or duplication of this material without express and written permission from this site’s author and/or owner is strictly prohibited. Excerpts and links may be used, provided that full and clear credit is given to Writing9 with appropriate and specific direction to the original content.
Vocabulary: Replace the words incidents, injuries, rail with synonyms.
▼
Vocabulary: The word "figures" was used 3 times.
▼
Vocabulary: The word "number of" was used 2 times.
▼