the graph below show the number of shops that closed and the number of new shops that opened in one country between 2011 and 2018.

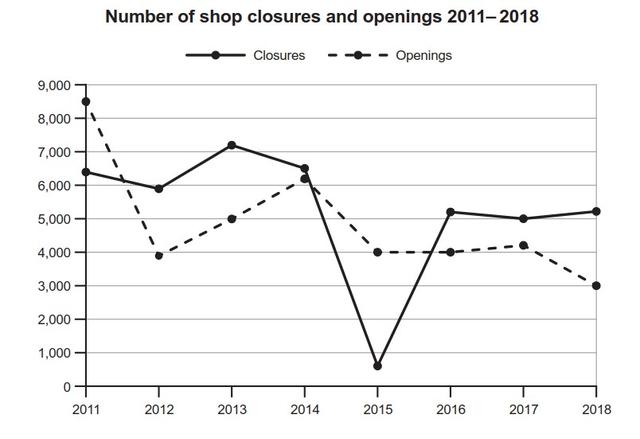
The line graph illustrates the number of
shops
in terms of closed and opened in one country over a period of 7 years.
Looking from an overall
perspective, it is readily apparent that the statistic of stores
that both closed and opened all saw a dramatic decrease between 2011 and 2018. However
, the number of closed stores
registered steep fluctuations.
A deep analysis of the graph provided reveals that the figure
for closed shops
experienced fluctuations in the given period. In 2011, there were around 6300 stores
had to close. From this
year, the number of shop closures began to increase and reached its peak, at around 7000 in 2013. By contrast
, this
figure
started to fall sharply to approximately 700 in the next two years. After witnessing a harsh reduction, the statistic of closed shops
saw a considerable climb to over 5000, and then
remained stable data in the next two years, at 5000 and over 5000 respectively.
As for shop openings, it can be seen that there was a significant decrease over a 7-year period. In the year 2011, there were about 8500 shops
opened in that country, at which point this
figure
started to fall sharply to 4000 in 2012. This
data started to rise roughly by 2000, at 6000 stores
in 2014, after which this
figure
reduced notably to 3000 in 2018.Submitted by yeshomeclass on
Unauthorized use and/or duplication of this material without express and written permission from this site’s author and/or owner is strictly prohibited. Excerpts and links may be used, provided that full and clear credit is given to Writing9 with appropriate and specific direction to the original content.
Vocabulary: Replace the words shops, stores, figure with synonyms.
▼
Vocabulary: Rephrase the word "number of" in your introduction.
▼
Vocabulary: The word "graph" was used 2 times.
▼
Vocabulary: The word "figure" was used 4 times.
▼
Vocabulary: The word "data" was used 2 times.
▼
Vocabulary: The word "number of" was used 3 times.
▼
Vocabulary: The word "decrease" was used 2 times.
▼
Vocabulary: The word "fall" was used 2 times.
▼
Vocabulary: The word "fluctuations" was used 2 times.
▼
Vocabulary: The word "around" was used 2 times.
▼