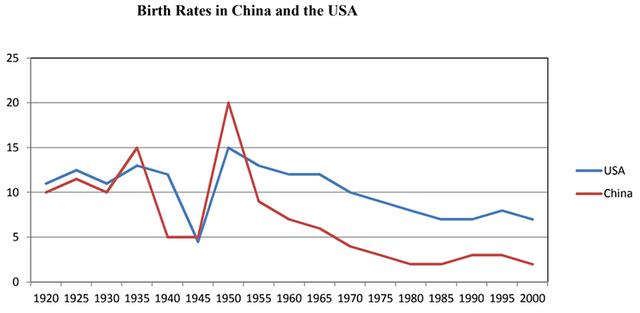
The graph below compares changes in the birth rates of china and the USA between 1920 and 2000.

A glance at the graph provided reveals the birth rates between
China
and the USA
from 1920 to 2000.It is evident that both nations saw considerable fluctuations during this
period.
It is clear that
birth rates in China
and the USA
had a constant decline from 1950 to 2000,by contrast
,the gap which started in 1940 increased dramatically until 1950.The figure
for China
and the USA
had fluctuations before 1950.
Increasing from approximately 10 per cent
in 1920 to 15 per cent
in 1935,the figure
for China
then
dropped rapidly to about 5 per cent
in 1940.This
was followed by a period of exponential growth that reached a peak of 20 per cent
in 1950,as twice as in 1920.The latter 50 years,however
,brought a sustained decrease in this
figure
.
Meanwhile,the USA
birth rate fluctuated at around 12 per cent
from 1920 to 1940,before dropping sharply to 5 per cent
in 1945.The following 5 years saw a rapid climb in this
figure
,at the top of 15 per cent
,then
, followed by a steady fall.Submitted by 2975842009 on
Unauthorized use and/or duplication of this material without express and written permission from this site’s author and/or owner is strictly prohibited. Excerpts and links may be used, provided that full and clear credit is given to Writing9 with appropriate and specific direction to the original content.
Vocabulary: Replace the words china, usa, figure, cent with synonyms.
▼
Vocabulary: The word "figure" was used 3 times.
▼
Vocabulary: The word "fluctuations" was used 3 times.
▼
Vocabulary: The word "rapidly" was used 2 times.
▼