The bar graph shows the global sales (in billions of dollars) of different types of digital games between 2000 and 2006. Write a report for a university, lecturer describing the information shown below. Summarise the information by selecting and reporting the main features and make comparisons where relevant. You should write at least 150 words.

#bar #sales #billions #dollars #games #report #university #lecturer #information #summarise #features #comparisons
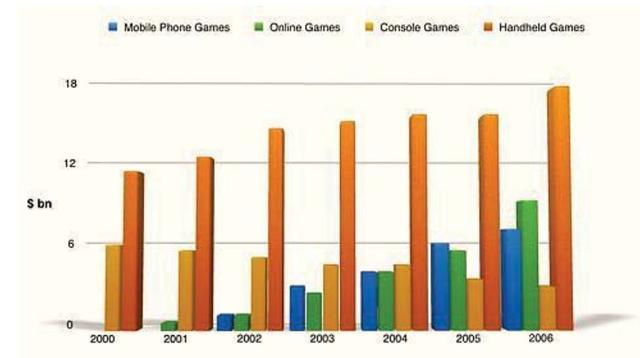
The bar chart depicts the global
sales
of four different types of digital games
from 2000 to 2006. Those data were denoted in billions of dollars.
Overall
, it can be seen from the graph that almost all kinds of game
encountered growth except for Console Games
during the 7 years
period.
Handheld Games
were the most demanding games
for seven consecutive years
. The growth was almost consistent except from 2004 to 2005 when the sales
were equal for both years
. In 2006, Handheld Games
sold eighteen billion dollars in sales
value which was recorded as the highest volume not only amongst other digital games
but also
the best achievement of its product for a decade.
In contrast
, Console Games
was one which did not perform well since their sales
number dissipated throughout the given period. It obtained 6 billion dollars of sales
in 2000, then
it became a downtrend for the next 3 years
, while
in 2004 their sales
were slightly hiked before they fell again to 2006.Submitted by raymondgandi on
Unauthorized use and/or duplication of this material without express and written permission from this site’s author and/or owner is strictly prohibited. Excerpts and links may be used, provided that full and clear credit is given to Writing9 with appropriate and specific direction to the original content.
Vocabulary: Rephrase your introduction. Words match: 73%.
▼
Vocabulary: Replace the words sales, games, years with synonyms.
▼
Vocabulary: The word "growth" was used 2 times.
▼
Vocabulary: The word "almost" was used 2 times.
▼