The graph and chart below give information on the average daily maximum and minimum temperatures in degrees Celsius (°C) and the average number of days with rainfall each month for two Australian cities. Write a report for a university, lecturer describing the information shown below. Summarise the information by selecting and reporting the main features and make comparisons where relevant.

#information #temperatures #degrees #celsius #°c #rainfall #month #two #australian #cities #report #university #lecturer #summarise #features #comparisons
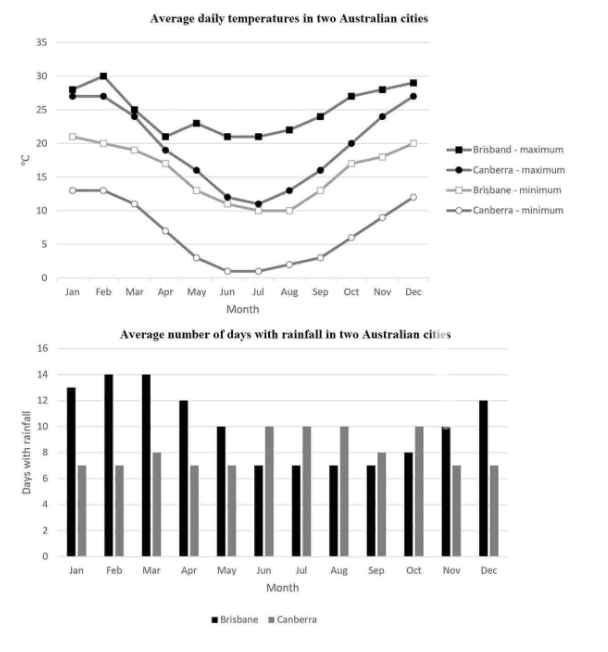
The given graph and bar
chart
below respectively depict the daily maximum and minimum temperatures
in
average within a day in Change preposition
on
Brisbane
and Canberra
and the average figures
of days
with rainfall
in each month for these two cities.
The first illustration directly shows that in total both the maximum and minimum temperatures
are higher throughout the whole year in Brisbane
than the ones
in Canberra
. On the other hand
, the bar chart
below points out that Brisbane
has larger numbers of days
with rainfall
in most months.
Having a glimpse of the chart
above, we can clearly see that in January, the average maximum and minimum temperatures
for Brisbane
and Canberra
are respectively 27 and 21 degree
Celsius
, and 27 and 12.5 degree
Celsius
. As time goes by, all of these figures
witness a decrease between 7 and 15 degree
Celsius
from January to July. Among these, the figure of maximum degree
for Brisbane
declines only from 27 to 11, in contrast
, its minimum declines from 12 to approximately 0. After
this
, all of the figures
experience a continuous rise from July to December. The highest and lowest average temperatures
in Brisbane
both rose by almost 10 degrees Celsius
from 20 and 10 to 30 and 20. Moreover
, the ones
in Canberra
increased by a similar amount, respectively from 10 and 2 to 20 and 12.
The bar chart
below vividly shows that from November to May, the average numbers of days
with rainfall
are much larger in Brisbane
than the ones
in Canberra
. Among these, in January and February, there're 13 days
with rainfall
in Brisbane
, which are as twice as much the
Change preposition
as the
ones
in Canberra
. However
, the figures
for rainfall
days
in Canberra
then
surpass from June to October. There're toughly 10 days
with rainfall
in Canberra
during this
period, while
the other Australian city only has no more than 8 days
.Submitted by Erica Zhang on
Unauthorized use and/or duplication of this material without express and written permission from this site’s author and/or owner is strictly prohibited. Excerpts and links may be used, provided that full and clear credit is given to Writing9 with appropriate and specific direction to the original content.
Sentences: Add more complex sentences.
▼
Common mistake: Your writing should be 150-250 words.
Vocabulary: Rephrase your introduction. Words match: 71%.
▼
Vocabulary: Replace the words chart, temperatures, brisbane, canberra, figures, days, rainfall, ones, degree, celsius with synonyms.
▼
Vocabulary: Rephrase the word "give" in your introduction.
▼
Vocabulary: The word "chart" was used 4 times.
▼
Vocabulary: The word "figures" was used 5 times.
▼
Vocabulary: The word "shows" was used 2 times.
▼
Vocabulary: The word "numbers of" was used 2 times.
▼
Vocabulary: The word "declines" was used 2 times.
▼