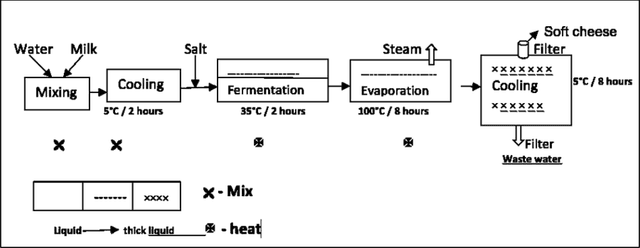
The diagram below shows the process of making soft cheese. Summarise the information by selecting and reporting the main features, and make comparisons where relevant. The given diagram illustrates the all process of making soft cheese briefly. The main five steps of production are mixing, cooling, fermentation, evaporation, and cooling.

#process #cheese #summarise #information #features #comparisons #five #steps #production #evaporation
The given picture illustrates how to produce soft cheese.
Overall
, as we can see, there are five main stages beginning with mixing, cooling, fermentation, evaporation and ending cooling.
According to
the diagram, in the first step, water and milk are combined together, creating a water-milk mixture. Secondly
, this
mixture will be cool down to 5 degree Celsius
for 2 hours
before being added some salts. After that, a combination including milk, water and salts will be put into the fermentation step for 2 hours
where the temperature is heated to 35 degrees Celsius
. Subsequently
, it can be seen that the workers will heat the temperature to 100 degrees Celsius
to make the evaporation happens for 8 hours
. The mixture will then
become steam before cooling down again at 5 degree Celsius
for 8 hours
at the final step. Last
but not least, after filtering the waste, the combination of thick liquid will create soft cheese.Submitted by kakaka03 on
Unauthorized use and/or duplication of this material without express and written permission from this site’s author and/or owner is strictly prohibited. Excerpts and links may be used, provided that full and clear credit is given to Writing9 with appropriate and specific direction to the original content.
Introduction: The introduction is missing.
▼
Introduction: The chart intro is missing.
▼
Introduction: The chart intro is missing.
▼
Vocabulary: Replace the words celsius, hours with synonyms.
▼
Vocabulary: Only 3 basic words for charts were used.
▼
Vocabulary: Use several vocabularies to present the data in the second paragraph.
▼