The graph below shows the number of overseas visitors to three different areas in a European country between 1987 and 2007

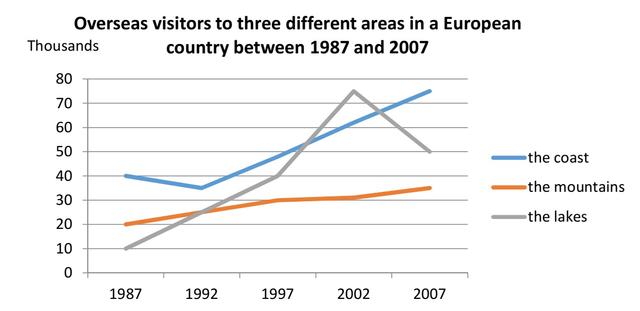
the number of international visitors to three different locations in a European nation over a period of 20
years
is depicted by a line graph.
it can be vividly seen that in the year 1987 visitors to the lakes were less than the other tourist spot. as attended by only 10 thousand
travellers. then
after, it recorded a steep growth in the number of travellers throughout 2002 and became the most visited tourist spot in that year. the number reached 75 thousand
in 2002. it shows a huge decline in the next five years
and stood at fifty thousand
in 2007. marching ahead, the mountains were the second most favourite place to visit by tourists with a total of 20 thousand
tourists in 1987. That tourist destination showed steady growth throughout the given period; from 1987 to 2007. it had thirty-five thousand
visitors in the year 2007 making it third place in the whole list.
moving towards the rest of the information, the coast was the highest foreigner count in 1987, forty thousand
people visited in this
time. the numbers slightly decreased in the next five years
and reached thirty-five thousand
. however
, a humongous growth can be seen in the next 15 years
. it was still the most visited zone with a figure of 75 thousand
tourists in 2007.
overall
, the coast was the most visited part throughout the said period. however
, the lakes became the least visited place among the three destinations.Submitted by vikas.rundla30 on
Unauthorized use and/or duplication of this material without express and written permission from this site’s author and/or owner is strictly prohibited. Excerpts and links may be used, provided that full and clear credit is given to Writing9 with appropriate and specific direction to the original content.
Linking words: Don't use the same linking words: "however".
▼
Introduction: The introduction is missing.
▼
Introduction: The chart intro is missing.
▼
Introduction: The chart intro is missing.
▼
Vocabulary: Replace the words years, thousand with synonyms.
▼
Vocabulary: Rephrase the word "number of" in your introduction.
▼
Vocabulary: The word "shows" was used 2 times.
▼
Vocabulary: The word "number of" was used 2 times.
▼
Vocabulary: The word "growth" was used 3 times.
▼
Vocabulary: The word "reached" was used 2 times.
▼
Vocabulary: Use several vocabularies to present the data in the fourth paragraph.
▼