The two pie charts shows the employment pattern in great Britain in 1992

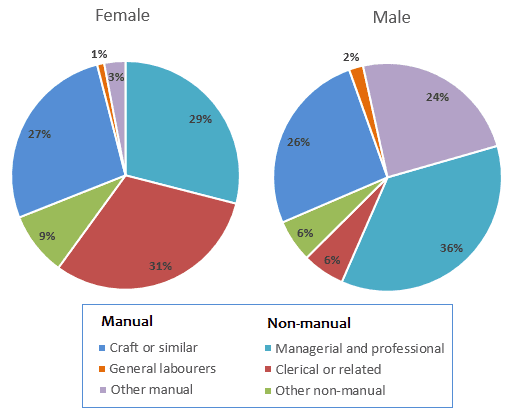
The pie charts give information about the employment pattern of both males and females in Great Britain in 1992.
This
is done in percentages. Overall
, it is observed that managerial and professional had the highest number of employees while
General labourers recorded the least.
To begin
, it is observed that both genders had a good number of persons in craft or similar with a figure of 27 per cent in female and 26 per cent in male respectively. The general labourers had 1% of women and 2% of men. Other manuals documented 24% of males which is 21% more than females which had 3%.
In regards to the non-manual , managerial and professional listed majority of both genders, with 36 per cent in of men and 29% women. Clerical had a figure of 31% and 6%.Other non-manuals had about 9% to 6% in males and females correspondingly.Submitted by leahjosh2 on
Unauthorized use and/or duplication of this material without express and written permission from this site’s author and/or owner is strictly prohibited. Excerpts and links may be used, provided that full and clear credit is given to Writing9 with appropriate and specific direction to the original content.
Common mistake: Your writing should be 150-250 words.
Vocabulary: Rephrase your introduction. Words match: 83%.
▼
Vocabulary: The word "figure" was used 2 times.
▼
Vocabulary: The word "number of" was used 2 times.
▼
Vocabulary: The word "about" was used 2 times.
▼