the pie charts below show the devices that people in the 18 to 25 age group use to watch television in canada in two different years.

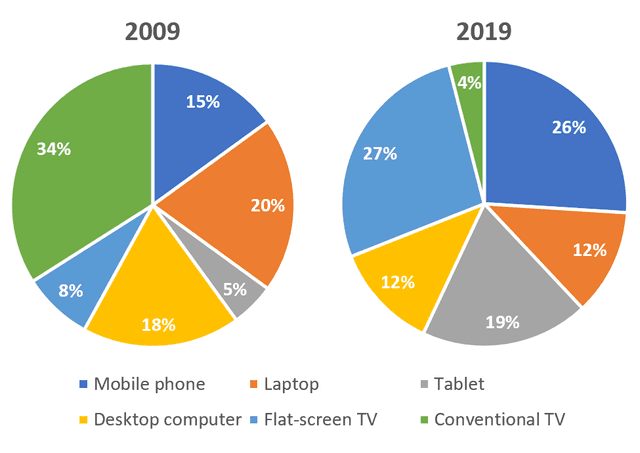
The given pie charts illustrate how Canadian adolescents and adults use different gadgets for watching
TV
between 2009 and 2019. Overall
, we can observe that at the beginning of the mentioned period, conventional TV
showed the highest proportion, and tablet was the least method in that year. In comparison, at the end
of the period flat-screen TV
represented the biggest rate, while
conventional TV
was the smallest number among all the devices.
Looking closely at the data, we can see that the conventional TV
segment accounted for 34% of the devices used in 2009 and experienced a dramatic decline reaching only 4% in 2019. The desktop computer was used by 18% in 2009, however
, this
sector had a slight decrease of 12% in 2019. In the first year, Laptop made up 20 per cent and this
percentage fell to just 12% at the end
of the mentioned period.
On the other hand
, mobile phone users were only 15% in 2009, and this
had a significant growth of 26% after ten years. Flat-screen and Tablet figures were just under one-tenth and 5% in 2009, respectively, and experienced a considerable increase with 27% and under a fifth in 2019.Submitted by alnaamiayat on
Unauthorized use and/or duplication of this material without express and written permission from this site’s author and/or owner is strictly prohibited. Excerpts and links may be used, provided that full and clear credit is given to Writing9 with appropriate and specific direction to the original content.
Linking words: Don't use the same linking words: "at the end".
▼
Vocabulary: Replace the words tv with synonyms.
▼