The chart below gives information about the household percentage of spending on essential goods in China for the years 1995 and 2011

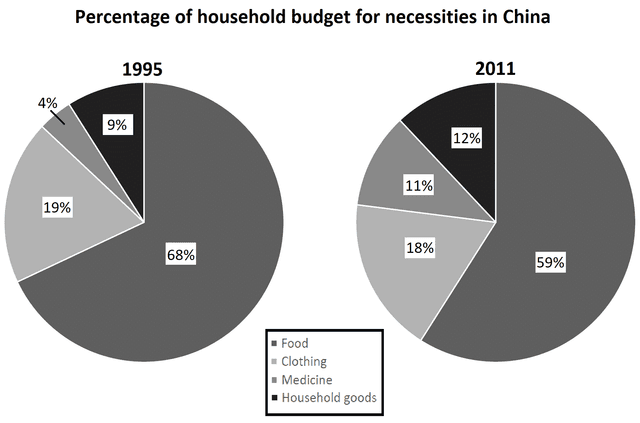
The given pie charts compare the proportion of spending per family on the four necessities in China in 1995 and 2011.
Overall
, the money spent on food and clothing decreased over the two reporting periods, while
the amount of cash used on purchasing medication and household items increased substantially over time.
With regard to the largest contributor to spending, food came in first place in both 1995 and 2011. However
, it is clear that
the Chinese spent a relatively lesser amount of food in 2011 than in 1995. Similarly
, money spent on clothing followed a similar trend, even though it was the second highest in both years, accounting for 19% in 1995 and 18% in 2011 respectively.
Regarding the least amount of expenditure (4%) spent on buying medications in 1995, the spending almost doubled in 2011. Likewise
, procuring household products mimic the same upward-growing pattern, showing a 3% climb from 9% in 1995 to 12% in 2011.Submitted by joewingpun1992 on
Unauthorized use and/or duplication of this material without express and written permission from this site’s author and/or owner is strictly prohibited. Excerpts and links may be used, provided that full and clear credit is given to Writing9 with appropriate and specific direction to the original content.
Sentences: Add more complex sentences.
▼
Vocabulary: The word "amount" was used 3 times.
▼