The graph below shows the number of tourists visiting a particular Caribbean island between 2010 and 2017.

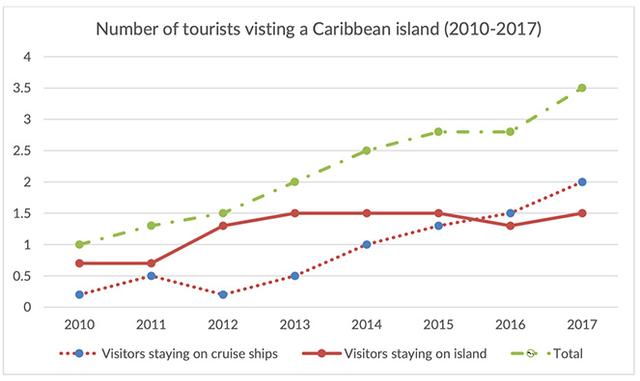
The line chart illustrates the trends of foreigners staying on a Caribbean island for seven years, from 2010 to 2017 (in millions).
Overall
, the total amount of people increased significantly over the whole period, while
the figure of tourists staying on either cruise ships or islands showed reversed each other.
Regarding the total number, we see that the proportion of travellers generally had rose consistently. For instance
, it is
started with 1000 thousand tourists visiting Caribbean islands in 2010, Unnecessary verb
apply
moreover
, soaring consistently to almost threefold. From 2015 to 2016, by contrast
, the trend had to hit a plateau before soaring again to the highest point of 350 thousand guests.
Turning to foreigners staying on the island, it is clear that
the figure was stable between 2010 and 2011 with just under 1000 thousand people, after that, it slightly rose and stagnant until 2015 to one and a half ton foreign travellers, before hitting its lowest point at approximately 1.25 ton. However
, the number of guests staying on cruise ships fluctuated and soared at the end
, furthermore
, fluctuating from 0.25 to 0.5 million between 2010 and 2012, then
rose consistently and reached its highest point of 2 million tourists.Submitted by denyyas1995 on
Unauthorized use and/or duplication of this material without express and written permission from this site’s author and/or owner is strictly prohibited. Excerpts and links may be used, provided that full and clear credit is given to Writing9 with appropriate and specific direction to the original content.
Vocabulary: The word "figure" was used 2 times.
▼
Vocabulary: The word "trends" was used 2 times.
▼