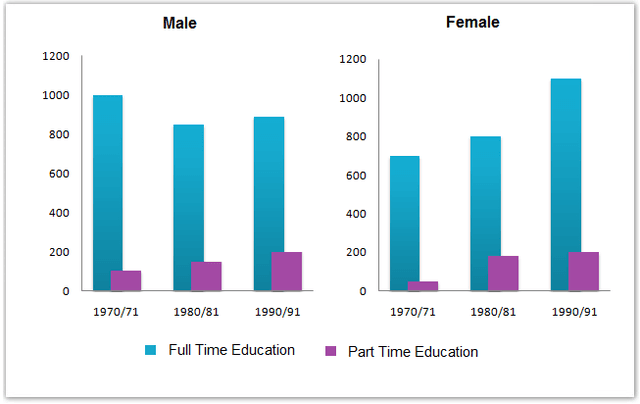
The chart below shows the number of men and women in further education in Britain in three periods and whether they were studying full-time or part-time. Write a report for a university lecturer describing the information shown below.

This
bar chart illustrates information about the number
of males and females in further
education that study full or part-time in Britain in three different periods of time.
Overall
, it is clear that
in all three ,terms women experienced an upward trend.
According to
the data from the bar ,chart it can be noticed that men's part-time education is declining. In the first term there are 1000 men then
this
sum dropped to 160. In the last
,term this
number
rose to make it a total of 900 students
. In addition
, amount of students
that were studying full-time only increased. At the beginning it was only 100 students
in the middle it rose to 50 students
then
in the final year this
statistic became 250 students
.
As can be seen from the chart at the start the number
of women that were educated full time was 50 students
even though in the next year term number
of females increased rapidly making it 200 and then
it stopped at 240 students
Submitted by Abdu.abetayev on
Unauthorized use and/or duplication of this material without express and written permission from this site’s author and/or owner is strictly prohibited. Excerpts and links may be used, provided that full and clear credit is given to Writing9 with appropriate and specific direction to the original content.
Vocabulary: Replace the words number, students with synonyms.
▼
Vocabulary: The word "chart" was used 3 times.
▼
Vocabulary: The word "number of" was used 3 times.
▼
Vocabulary: The word "increased" was used 2 times.
▼