The chart bellow shows the results of a survey about people's coffee and tea buying and drinking habits in five Australian cities.

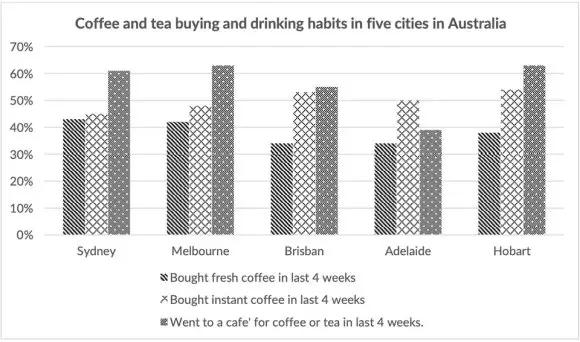
The bar graph gives data about the number of buying and drinking habits of
coffee
and tea in five cities in Australia. Overall
, the percentage of people
who drank coffee
or tea in a café constituted the largest proportion, while
only a few people
bought either fresh or instant coffee
in the last
month.
Regarding the statistics, we see that people
who visited a café for buying some coffee
or tea had generally the highest point, with Melbourne, Hobart, and Sydney reaching over three-fifths, and it is followed by Brisbane approximately over half of the local residents. In Adelaide, by contrast
, it had the lowest point by just under a half.
Turning to people
who bought instant coffee
, there is not a significant divergence in the five cities, ranging from above 45% to under 55%. Besides
that, people
who bought fresh coffee
in Sydney and Melbourne was the highest proportion, with 44% and 43% respectively, whereas
Brisbane and Adelaide showed the lowest point just nearly a third.Submitted by denyyas1995 on
Unauthorized use and/or duplication of this material without express and written permission from this site’s author and/or owner is strictly prohibited. Excerpts and links may be used, provided that full and clear credit is given to Writing9 with appropriate and specific direction to the original content.
Vocabulary: Replace the words coffee, people with synonyms.
▼
Vocabulary: The word "proportion" was used 2 times.
▼