Task 1. The line graph illustrates the proportion of tourists who visited Brighton attractions in England from 1980 to 2010.

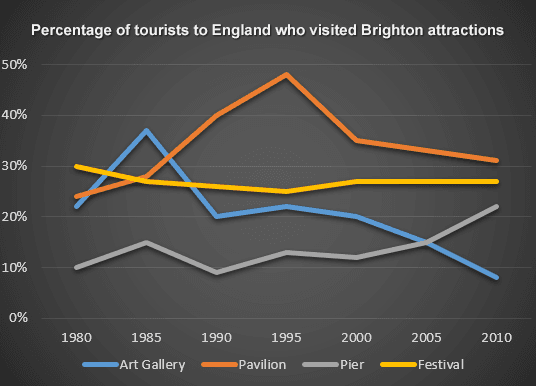
The line graph depicts the percentage of
visitors
to tourist spots in Brighton, including the Art
Gallery
, Pier
, Pavilion and Festivals
. This
study was conducted over a period of 30 years commencing from 1980 to 2010.
At first glance, it is recognizable that overall
, exploring Festivals
was the most popular activity over time, whereas
, there were fewer visitors
to Pier
, which attracted some eyeballs during this
period.
Looking at the data in more detail, more than 30% of tourists attended Festivals
, which was the highest rate in 1980 compared to others. In the meantime, the pavilion and Art
Gallery
had approximately the same number
of guests, with slightly above 20%. They are followed by the Pier
which had a fewer proportion of tourists.
After fifteen years, a dramatic increase was observed in the rate of pavilion's visitors
, till it reached its peak gradually below 50%, in contrast
, there was a downtrend in the number
of people visiting Festivals
, whilst, the number
of individuals exploring both Pier
and Art
Gallery
fluctuated, the former gained some popularity in comparison to the latter, which has a significant decline in the explorers' proportion. After the end of the 20th century, there was a sharp increase in the percentage of people discovering the Pier
, on the contrary
, the number
of Art
Gallery
visitors
dramatically plunged, and at the same time, Festivals
got back some more attention.Submitted by anislom26 on
Unauthorized use and/or duplication of this material without express and written permission from this site’s author and/or owner is strictly prohibited. Excerpts and links may be used, provided that full and clear credit is given to Writing9 with appropriate and specific direction to the original content.
Vocabulary: Replace the words visitors, art, gallery, pier, festivals, number with synonyms.
▼
Vocabulary: The word "number of" was used 4 times.
▼
Vocabulary: The word "percentage" was used 2 times.
▼
Vocabulary: The word "proportion" was used 2 times.
▼
Vocabulary: The word "increase" was used 2 times.
▼
Vocabulary: The word "dramatic" was used 2 times.
▼
Vocabulary: Use several vocabularies to present the data in the second paragraph.
▼