The bar chart shows coffee and tea buying and drinking habits in five Australian cuties. Summarize the information by selecting and reporting the main features and comparisons where relevant.

The bar graph depicts the drinking lifestyle of Australian citizens in recent 4 weeks in five different cities, namely
Sydney
, Melbourne, Brisban, Adelaide
and Hobart.
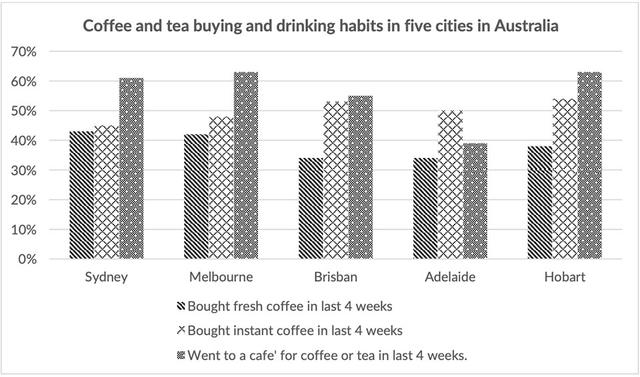
At first glance, it is recognizable that overall
, heading to a cafe for a cappuccino or tea was the most popular habit among the people in these cities, whereas
, the purchase of fresh coffee
was their less common activity.
Looking at the data in more detail, more than 62% of Hobart's dwellers as well as
Melbourne's visited a cafe to drink their favourite beverage either tea or espresso, in contrast
, they are followed by the citizens of Sydney
, Brisbon and Adelaide
, who accounted for 60%, almost 55% and 40% of the consumption of these items at the cafe respectively. In addition
, there was a tie in the number of people in Hobart and Brisban, with gradually above 50% of them purchasing immediate espresso, in the meantime, 50% of Adelaide
's inhabitants copied this
habit, whilst, 45% of people in Sydney
bought quick coffee
. However
, regarding the attainment of fresh coffee
, the consumers in Sydney
and Melbourne had the same ratio of the population buying fresh coffee
, whilst, a tie rate of citizens consuming this
type of caffeine was observed in Adelaide
and Brisban.Submitted by anislom26 on
Unauthorized use and/or duplication of this material without express and written permission from this site’s author and/or owner is strictly prohibited. Excerpts and links may be used, provided that full and clear credit is given to Writing9 with appropriate and specific direction to the original content.
Vocabulary: Replace the words sydney, adelaide, coffee with synonyms.
▼
Vocabulary: Use several vocabularies to present the data in the second paragraph.
▼