2006 The line graph below shows the oil production and consumption in China between 1982 and

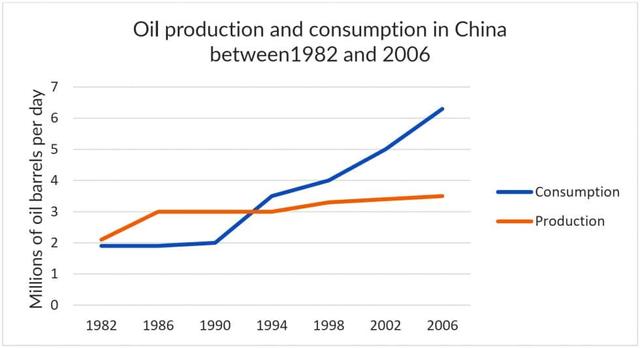
The line chart depicts information about how much
oil
was produced and consumed in China from 1982 to 2006.
Overall
, it is clear from the graph that there was an upward trend in both production
and consumption of oil
during the given period
. In addition
, oil
consumption climbed significantly faster in comparison with its production
over 24 years.
At the beginning of the period
, the figures for both oil
production
and consumption were nearly equal, at around 2 million
oil
barrels per day. After 8 years, the amount of oil
produced experienced a dramatic rise by 2 million
barrels and remained unchanged until 1994. Meanwhile, that of oil
consumed witnessed stability until 1900, after which it grew remarkably to 3 million
in 1994.
In the second haft of the period
, the figure for oil
production
saw a slight increase to 3,5 million
barrels per day. By contrast
, the amount of oil
consumed grew steadily by 1 million
every 4 years and finally
reached a peak of 6 million
at the end
of the period
.Submitted by itsnotanhtran on
Unauthorized use and/or duplication of this material without express and written permission from this site’s author and/or owner is strictly prohibited. Excerpts and links may be used, provided that full and clear credit is given to Writing9 with appropriate and specific direction to the original content.
Vocabulary: Replace the words oil, production, period, million with synonyms.
▼
Vocabulary: The word "figures" was used 2 times.
▼
Vocabulary: The word "amount" was used 2 times.
▼