the charts below show the average percentages in typical meals of noutrientd, all of which may be unhealthy if eaten too much.

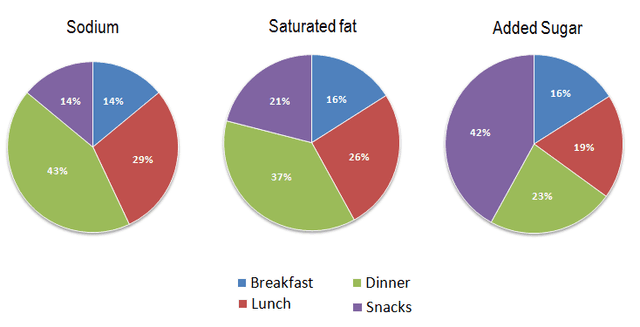
The pie charts illustrate the comparison between
sodium
, saturated fat, and added sugar
in four types of meals (breakfast
, lunch, dinner
, and snacks) in the USA.
Overall
, dinner
is more likely to contain the highest of the three nutrients except for added sugar
. In contrast
, breakfast
has the lowest three of them, which may the healthiest one.
Both sodium
and saturated fat are the biggest contributors to dinner
with percentages of 43% and 37% respectively. Furthermore
, lunch is in second place with sodium
(29%) and saturated fat (26%). Ranging from 14% to 21%, breakfast
and snacks tend to be less in sodium
and saturated fat.
However
, the added sugar
was significantly high in snacks by 42% of it. Moreover
, 23% of added sugar
is contained in dinner
meals, followed by lunch meals with a discrepancy of 4% compared to dinner
. Meanwhile, the least added sugar
contained in breakfast
with only 16%.Submitted by nurikasetyar on
Unauthorized use and/or duplication of this material without express and written permission from this site’s author and/or owner is strictly prohibited. Excerpts and links may be used, provided that full and clear credit is given to Writing9 with appropriate and specific direction to the original content.
Vocabulary: Replace the words sodium, sugar, breakfast, dinner with synonyms.
▼
Vocabulary: Only 6 basic words for charts were used.
▼
Vocabulary: Use several vocabularies to present the data in the second paragraph.
▼