The chart below shows the value of one country’s exports in various categories during 2015 and 2016. The table shows the percentage change in each category of exports in 2016 compared with 2015.

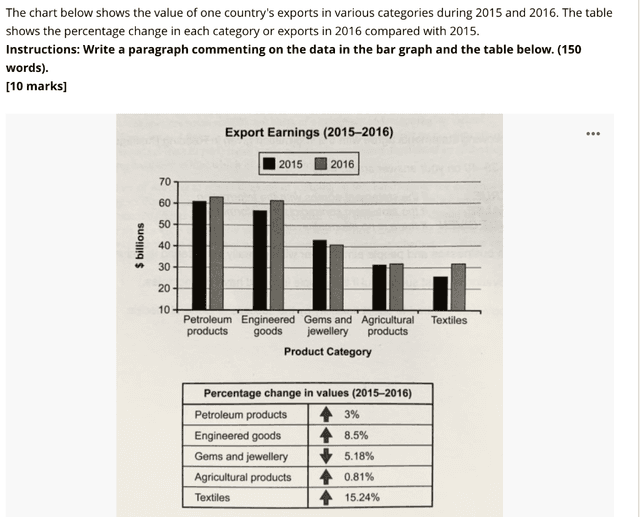
The bar chart provided illustrates the export earnings of a country in five categories,
while
the table outlines the percentage change between 2015 and 2016.
Overall
, it is apparent that all earnings had increased except for gems and jewellery, which experienced a marginal drop. The two primary earnings were petroleum products, which went up 3% from 62 billion
to around 63 billion
, and engineered goods, which grew more rapidly from 57 billion
to approximately 61 billion
during the given period.
To be specific, the other three categories shared much lower sales compared to these two exports. Gems and jewellery were the only types that witnessed a decline of 5.18%, falling from 45 billion
to roughly 42 billion
. As for agricultural products, the trend remained stable with a rise of only 0.81%. The most significant increase was in the textile industry, which grew sharply by 15.24% from 27 billion
to 33 billion
.Submitted by qwertyuiop9420 on
Unauthorized use and/or duplication of this material without express and written permission from this site’s author and/or owner is strictly prohibited. Excerpts and links may be used, provided that full and clear credit is given to Writing9 with appropriate and specific direction to the original content.
Sentences: Add more complex sentences.
▼
Vocabulary: Replace the words billion with synonyms.
▼
Vocabulary: Rephrase the word "percentage" in your introduction.
▼
Vocabulary: The word "increased" was used 2 times.
▼