The graph below shows the number of shops that closed and the number of new shops that opened in one country between 2011 and 2018.

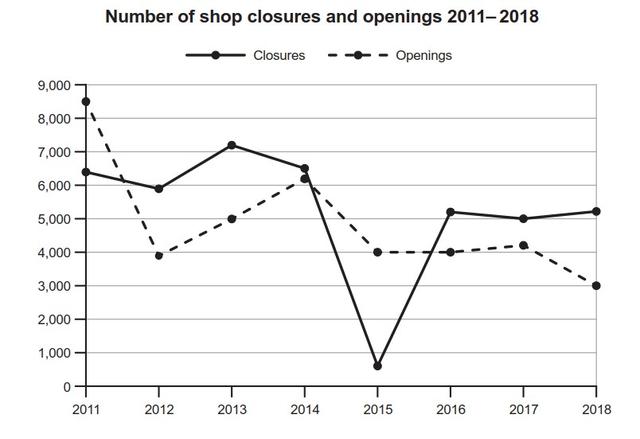
the line graphs compare the number of shops which open and closed between 2010 to 2017.
First of all the opened stores line started with 8500 in 20011. Next year we could see a sharp reduction till to 4000.
then
it is shown a significant increase for two years, it reached 6000.from 2014 to 2015 the number of shops illustrated a drop ,from 6000 to 4000. it was constant from 2015 to 2017 and is shown a gentle increase in 2017. in the latest ,year it decreased to 3000.
besides
it , the line graph of closed stores is begun with 6500 in 2011 and with a slight go down. It reached 6000 next year. then
it reached 7000 in 2013 and again decline in 2014 and is illustrated at 6500. After that it is shown a sharp decrease to 500 in 2015 .from 2015 to 2016 it is shown about 5000 and it is approximately constant till 2018.
overall
, both of the graph lines of opened and shut shops are shown a decrease in eight years.Submitted by aamin.1245 on
Unauthorized use and/or duplication of this material without express and written permission from this site’s author and/or owner is strictly prohibited. Excerpts and links may be used, provided that full and clear credit is given to Writing9 with appropriate and specific direction to the original content.
Vocabulary: Rephrase the word "number of" in your introduction.
▼
Vocabulary: The word "graphs" was used 3 times.
▼
Vocabulary: The word "illustrated" was used 2 times.
▼
Vocabulary: The word "number of" was used 2 times.
▼
Vocabulary: The word "decreased" was used 3 times.
▼
Vocabulary: The word "increase" was used 2 times.
▼
Vocabulary: The word "reached" was used 3 times.
▼