The table below shows the production of milk annually in four countries in 1990, 2000 and 2010.

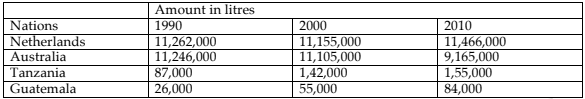
the table illustrates the
production
of milk
per year in 4 particular nations in the years 1990, 2000 and 2010.
overall
, while
the manufacture of milk
in Tanzania and Guatemala followed an upward trend throughout the surveyed period, the figure for milk
production
in Australia was recorded to decrease slightly. remarkably, the amount of milk
produced in the Netherlands witnessed an inconsistent trajectory.
turning to the detail, in 1990, the production
of milk
in Tanzania accounted for 87000 litres
and then
recorded a dramatic increase to over 140000 milk
litres
, after which this
category hit its peak of 155000 litres
at the end
of the period. milk
production
in Guatemala also
followed a similar pattern. this
figure increased by roughly 30 litres
between 1990 and 2000 before ending at 84000 litres
in the next 10 years.
in contrast
, there was a significant fall in the production
of milk
in Australia, accounting for 11105000 litres
in 2000, and constantly dropped to 9165000 litres
until 2010. additionally
, the category of Netherlands milk
rose to 11155000 litres
per year in 2000, finishing with 11466000 litres
Submitted by bobong120906 on
Unauthorized use and/or duplication of this material without express and written permission from this site’s author and/or owner is strictly prohibited. Excerpts and links may be used, provided that full and clear credit is given to Writing9 with appropriate and specific direction to the original content.
Vocabulary: Replace the words production, milk, litres with synonyms.
▼
Vocabulary: Rephrase the word "undefined" in your introduction.
▼
Vocabulary: The word "figure" was used 2 times.
▼
Vocabulary: The word "increase" was used 2 times.
▼