The line graph shows the percentage of spending in a European country from 1960 to 2000.

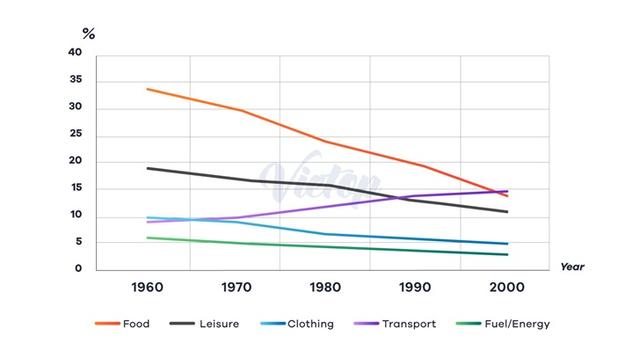
The line graph illustrates how the population of a European country spent their money on
food
, leisure, clothing, transport, and energy
from 1960 to 2000.
Overall
, the most money was spent on food
, while
the figure for energy
was the lowest. The expenditure witnessed a downward trend for all except the figure for transportation, which witnessed an upward trend.
In the 1960s, the percentage of people's income spent on food
was the highest, hitting a peak under 35%, which would nearly double the spending on leisure (at 20%). In the same year, the expenditure on clothing stood at 10%, 1% higher than the total for transport and energy
, with respective figures of 9% and 5%.
Thereafter
, the spending on transport increased considerably to 15%, which is the highest figure of all in 2000. By contrast
, the spent on food
and leisure registered a dramatically
decline to 14% and 12%. The remaining figures Change the adverb
dramatic
also
followed similar patterns, but were less pronounced, with respective figures for clothing and energy
being 5% and 2% arrivals in 2000.Submitted by vihoaithichngu on
Unauthorized use and/or duplication of this material without express and written permission from this site’s author and/or owner is strictly prohibited. Excerpts and links may be used, provided that full and clear credit is given to Writing9 with appropriate and specific direction to the original content.
Vocabulary: Replace the words food, energy with synonyms.
▼
Vocabulary: The word "figure" was used 6 times.
▼
Vocabulary: The word "trend" was used 2 times.
▼