The table and chart below give information on police budget

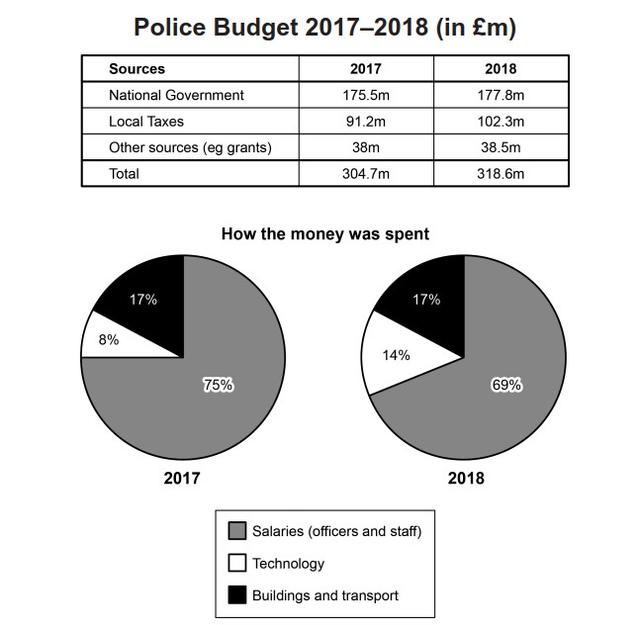
The table illustrated the police funding over two years,
while
, the pie chart showed explained how the money was spent on salaries,technology, buildings and transport during 2017 and 2018.
Overall
, it is clear that
although
the police budget indicated a rise , the salaries of employees decreased slightly throughout these two years.
Regarding the police budget over this
period, the national government personalized about 3 million in the next year compared to the previous, following
this
local taxes increased significantly the sum of money around 11.1 million .In addition
, revenue from other sources such
as grants allocated approximately a half million rose slowly over the year .
It can be seen from the two pie charts, according to
the information that the fund spent on wages fell dramatically in 2018, and then
the money spent on buildings and sports remained stable ,and lately, the smallest proportion was dedicated to technology which rose considerably nearby 14% in 2018.Unauthorized use and/or duplication of this material without express and written permission from this site’s author and/or owner is strictly prohibited. Excerpts and links may be used, provided that full and clear credit is given to Writing9 with appropriate and specific direction to the original content.
Vocabulary: The word "chart" was used 2 times.
▼