The table below shows the percentage of adults in urban and rural areas who took part in four free time activities in 1990 and 2010. Summarise the information and compare where relevant, by selecting and reporting the key features.

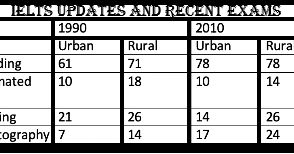
The table illustrates the proportion of developed people in rural and urban areas who participated in four leisure-time activities between 1995 and 2010.
Overall
, there were two activities that altered over course of a decade. These were namely, reading and photography. Reading was the most popular activity between 1995 and 2010 in both urban and rural areas. But ,the players in both rural and urban spaces changed significantly.
The number of people engaged in reading as a leisure activity increased rapidly in both rural and urban areas between 1990 and 2010 with 61% and 71% respectively.However
, a small portion just over 25% in rural parts, did take part in playing between 1990 and 2010. While
urban space had a ratio of 21% and 14% respectively.
A small percentage of people took part in photography in urban spaces, But, the rural part saw a major variation in the amount of 14% and 24% between 1990 and 2010.Submitted by taseen_shafquat on
Unauthorized use and/or duplication of this material without express and written permission from this site’s author and/or owner is strictly prohibited. Excerpts and links may be used, provided that full and clear credit is given to Writing9 with appropriate and specific direction to the original content.
Sentences: Add more complex sentences.
▼