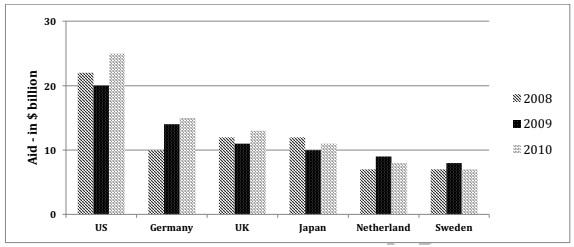
the chart below shows the aid form six developed countries to devloping countries from 2008-2009

This
bar graph gives us pieces of information about aid
in $ billion
that six developed countries received from 2008 to 2010.
Overall
, we can see that The United States of America is by far away the country that received the most aid
over these 3 years with a gap of 10 $ billion
with the second country on the chart in 2010.
In these 3 years
there is no debate that the Us received much more Add a comma
,years
aid
than the other countries. In 2009 aid
was approximately 22 $ billion
before slightly decreasing to 20 $ billion
but finally
raised again in 2010 until
25 $ Change preposition
to
billion
aid
. Germany seems to be the second country. Indeed Germany knew a gradually grow of aid
over these 3 years with aid
equal to 10, 14 and 15 $ billion
in 2008, 2009 and 2010 respectively. Uk and Japan received average aid
of just over 10 $ billion
from 2008 to 2010.
In add
, Replace the word
addition
Netherland
and Sweden were the countries receiving less Fix the agreement mistake
Netherlands
aid
with a peak in 2009 reaching approximately 9 $ billion
for both.Submitted by t.teiva on
Unauthorized use and/or duplication of this material without express and written permission from this site’s author and/or owner is strictly prohibited. Excerpts and links may be used, provided that full and clear credit is given to Writing9 with appropriate and specific direction to the original content.
Sentences: Add more complex sentences.
▼
Vocabulary: Replace the words aid, billion with synonyms.
▼
Vocabulary: The word "approximately" was used 2 times.
▼