The graph shows the life expectancy of people living in Asian regions from 1950 and predicts life expectancy until 2300. Summarize the information by selecting and reporting the main feature, and make comparisons where relevant. Write at least 150 words.

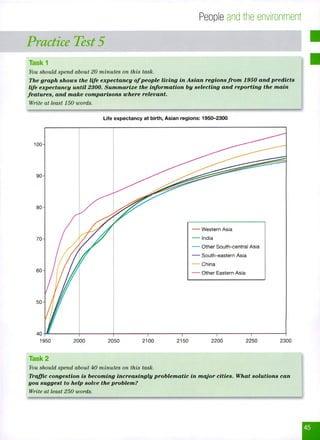
The provided chart depicts the people's life expectancy in different Asian regions from 1950 and predicts the numbers until 2300.
As can be seen, the age number for all regions increased dramatically between 1950 and 2000, and it
then
started to climb on a linear slope. The graphs for all regions have enjoyed an upward trend during the given period. Now they are continuing to soar, and it is predicted that they will continue to go up gradually until 2300.
India, Other South-central Asia
, South-eastern Asia
, and China began to rise from the number 40 while
Western Asia
and Other Eastern Asia
’s initial numbers were 44 and 52, respectively. Other Eastern Asia
has been on top of the other all the time, and it is projected that by 2300 it will reach a figure above 100. However
, whereas
Western Asia
has enjoyed the second level until now, it is expected to be around 93 in the fifth level, and China will get its place and achieve the age of 98 by 2300.Submitted by haq1366 on
Unauthorized use and/or duplication of this material without express and written permission from this site’s author and/or owner is strictly prohibited. Excerpts and links may be used, provided that full and clear credit is given to Writing9 with appropriate and specific direction to the original content.
Vocabulary: Rephrase your introduction. Words match: 69%.
▼
Vocabulary: Replace the words asia with synonyms.
▼