IELTS Writing Samples Band 8.5
The tourism industry is one of the essential industries in many countries. People visit other countries to explore and experience the culture. To accommodate such tourists the host countries usually cut down trees to build resorts and hotels. This is resulting in very serious ecological issues. This essay will discuss the problems and possible solutions to them.
In recent times, we can observe a very big decline in economic conditions. This is observed in many countries across the globe. In these situations, I totally agree with the statement countries should help each other to solve this problem. This essay will provide reasons and examples to support why they should help each other in this situation.
Unpaid society jobs should be mandatory for teenagers during their free hours to ensure both teenagers as well as communities are getting benefitted. I completely agree with the opinion as while doing so, these children will learn and gain invaluable experience, further, it will give them a sense of happiness and achievement by helping others.
8.5
band
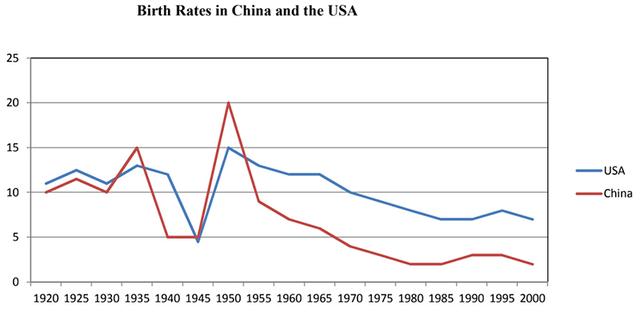
The line graph provides the proportions of births taking place in China and in the USA during an eight decades time frame going from 1920 to 2000.

A debate over which help of the international organizations is more important for the poor countries, donating lots of funding or dispatching professional staff and offering some practical suggestions has gained attention. While some argue that money is important, others state that useful guidelines from professionals are vital. I personally agree with both of them are essential.
It is true that in some parts of our world people are pursuing buying their own homes rather than renting them. There are various reasons to explain why this is the case. In my opinion, this trend could lead to more drawbacks than positives.
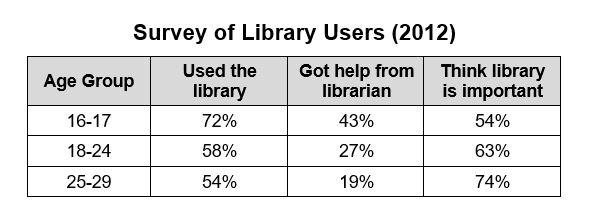
The table indicates the rate of users' aims upon three categories and the bar chart reveals the rate of reasons why individuals used the library in terms of three age groups in 2012.

I am your neighbour who is an apartment located next to your cafe. I usually decided to use this pathway in order to reach my business. However, I have noticed that on the individual's ,pavement there is a vast of mise en plus placed for 2 weeks. I am writing this letter to you to complain about your unfair area invasion.
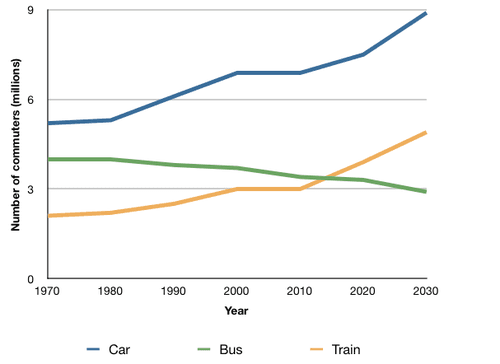
The line chart gives data about the median number of UK travellers using public transport such as cars, buses, or trains between 1970 and 2030. From an overall perspective, it is readily apparent that while all three groups started at a similar level, in the end, automobiles were the most prioritized, plus the others had a steady increase and decrease.

A glance at the table provided reveals the number and change rate of the academic staff, as well as the teacher per student data in different subjects in a university.

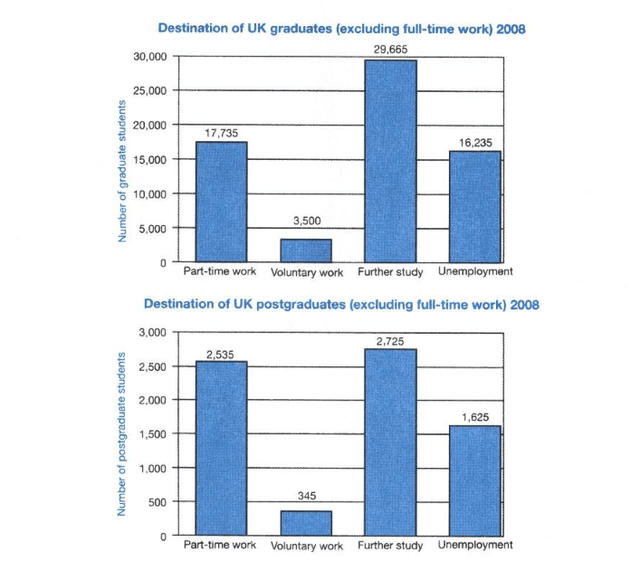
The graphs set out four further orientations that graduated students did after pursuing their degree from the university in 2008. Generally, while studying further was the most likely choice, voluntary jobs were the least popular among graduates and postgraduates.

A debate over whether or not it is vital for people to be honest at all times has gained attention. While some argue that there is no need to tell truth all the time, I disagree with this statement. I personally agree that it is reasonable to tell truth on all occasions.
A glance at a line graph provided reveals the breakdown of closed and brand new opened stores in one location from 2011 to 2018. Overall, there was a recessive growth pattern witnessed in openings which followed the opposite trend in comparison to closing.

So far, the problems with transportation and housing in urban areas are extremely alarming. Therefore, it is true that the legal bodies encourage firms to transport to the suburbs to handle this matter. From my perspective, this strategy is beneficial to a certain extent. The following paragraphs would shed light on my viewpoint.
Some individuals believe that affluence affords the wealthy a favourable opportunity to assist the disadvantaged. Although this tendency is not required for the wealthy, I believe this viewpoint is correct because it enhances the quality of life and society as a whole.
It is often argued whether pupils should start their career after tertiary level education or just after their schooling . Although there are some career opportunities after school level , I believe that there are a lot of job opportunities if students are having their university academics .
There are opinions that the press is the most efficient way to get info, while others argue that other media platforms are more advantageous. This essay will discuss both sides and draw my conclusion.
A debate over whether or not some electric devices like mobile phones and computers are harmful to the young generation, especially in the aspect of reading and writing skills has gained attention. While some argue that it brings a terrible impact. I disagree with the statement above. I personally agree that it makes a positive effect on improving the reading and writing skills of the group at young ages.
A glance at the bar charts provided reveals the rate of household expenditures in terms of six countries in 2000 and the projections for 2025 and 2050.

The Internet has improved our lives and it is helping in most of our activities. Despite some scepticism, a web connection has become the most useful tool we have.