IELTS Writing Samples Band 8
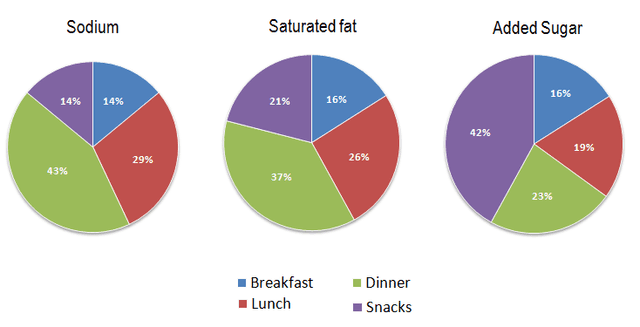
The pie charts compare the proportions of three unhealthy nutrients consumed by the average resident in the USA in each meal and in snacks in a day.

In recent times, some individuals mostly prefer to live with family or friends , while some sections of society choose to live alone. There are many advantages to doing both these however, in my opinion, I prefer to do the latter thing. Hence, the essay will discuss the benefits of both activities.
A lot of individuals has devoted most of their life to work and forget to enjoy the other things outside their offices. I believe it is vital to incorporate work-life balance to lessen stress and improve our health in various ways. In this essay, the afore-mended reasons will be dissected and a concluding view at the end.
The graph illustrates how the solar system function to convert solar power into electricity for residential usage.


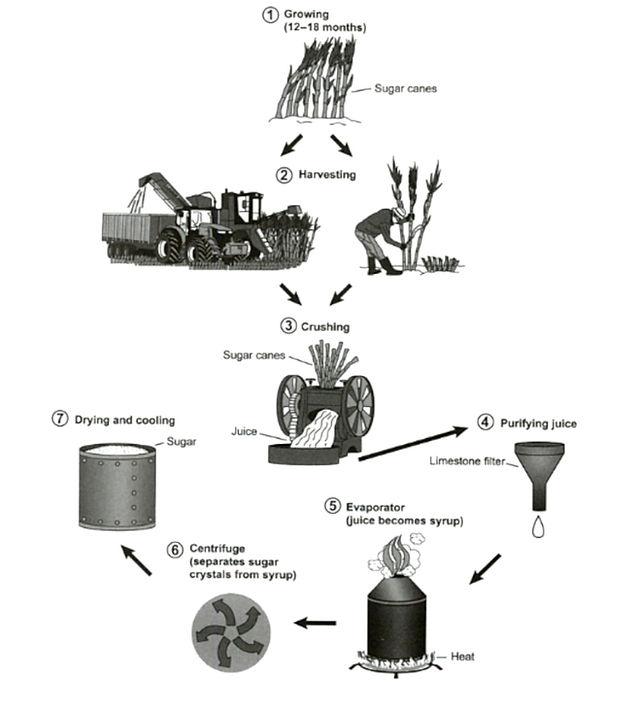
The presented diagram depicts the process of manufacturing to produce sugar from sugar cane. From an overall perspective, as can be seen from the process, this procedure is divided into seven main steps for preparing sugar grains.

It is asserted by few that due to elevating number of ,vehicles there is more need to spend a large number of funds on maintaining roadways and this cost must be bear by high authorities but there is a strong counter-argument amongst sections of people that the drivers pay money of the maintaining the road systems.This is a matter to be debated in the light of several factors which would be discussed in the following paragraphs along with my opinion.
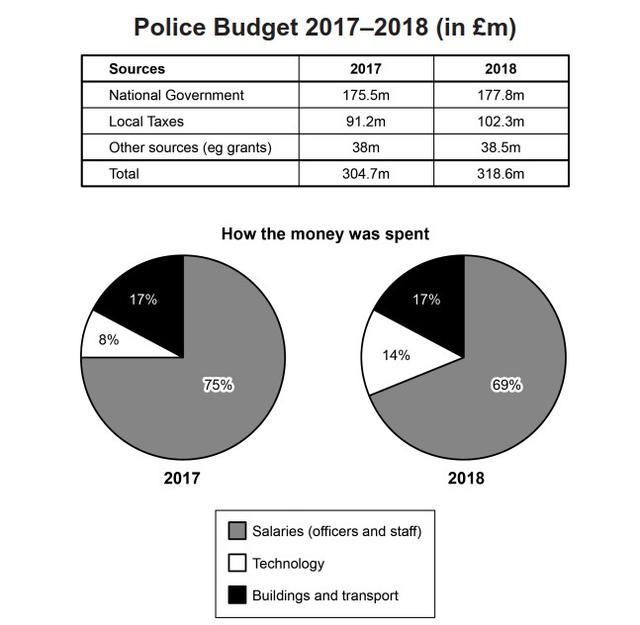
The pie chart and graph provided depict the capital invested its sources in Britain’s police for the years 2017 and 2018.

Global warming is a main concern nowadays. Developed nations have direct responsibility for the environmental issues that are affecting our planet. This essay will discuss why is phenomenon is a trouble and provide alternatives on how to lessen its impact.
Formerly, individuals were fed with provincial seasonable meals. Presently, humans purchase global food- products. I presume that the consumption of worldly known food- products has more benefits than costs.
Nowadays, travelling becomes affordable and young people say that going to different countries benefits them and society. And I totally agree with that point. My take on this is that it can help youth to develop their social, language and communicative skills. It has a great impact on society and I'm going to prove it in this essay.
Being physical is an essential component of good health which is why most people often debate whether play should be part of school basic programs. I completely agree with the above statement and will discuss my reasons for taking that stance.
8
band
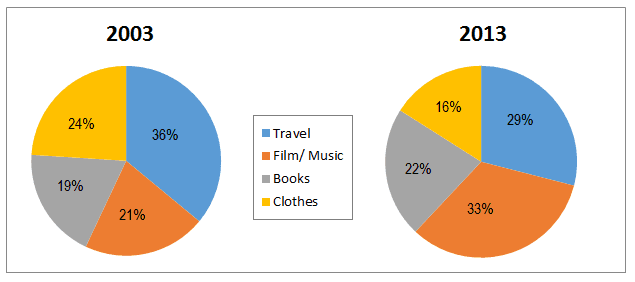
The pie charts compare the shares of four different e-commerce retail sales categories, such as travel, film or music, books and clothes in New Zealand in individual years 2003 and 2013.

Looking at the world it is clear that we are surrounded by people who are talented at singing and drawing. However, the dilemma is who should be responsible for funding them. My view is that money for art projects should come from governments.
Since the advent of advanced technology, the methods of communication among societies have utterly altered, nonetheless, a plethora of questions about this matter have remained neither answered nor conveniently responded such as in which ways have the relationships between people been impacted by this advancement? does the advantage of this outweigh its disadvantages? In this essay, concrete evidence will be given to reply to these questions.
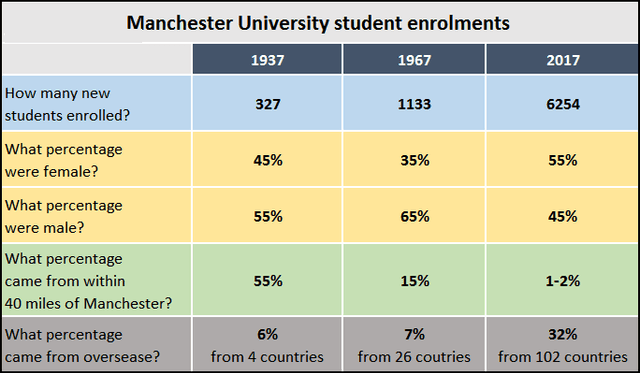
the table indicates data regarding individuals who enrol in Manchester University in three different years, which are 1937, 1967 and 2017. As seen in the table, there was a consistent rise in the number of students who enrolled. In addition, the proportion of international students also experienced significant growth.

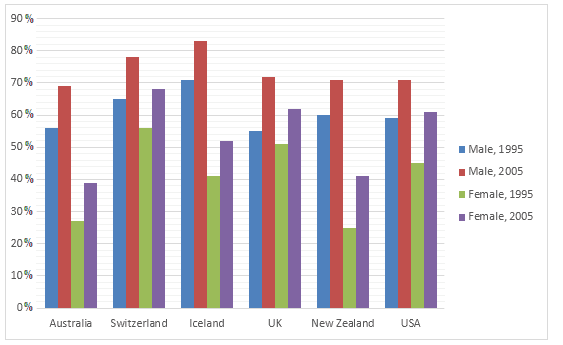
The bar graph depicts the details regarding the male and female enrollment rates in six different nations from 1995 to 2005.The data is calibrated in percentage.

Nowadays,it is very popular in many places for some folks to discover the stories or events that happened in their houses in the past.In my opinion,it is reasonable for them to do so,and there are many ways to help them to do it .
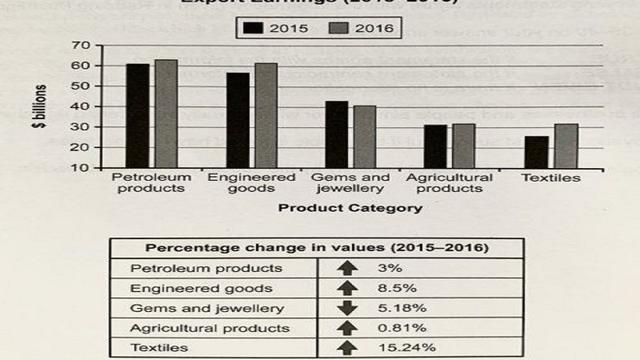
The bar chart compares how much a certain country earned through its exports of five categories of products in the years 2015 and 2016. The table gives information on the corresponding ratio changes in export revenues from these five product categories in these two years.

The pie charts compare the proportions of three nutrients, namely sodium, saturated fat and added sugar, in the breakfast, lunch, dinner and snacks of American citizens. These three nutrients can have negative effects when they are overused.

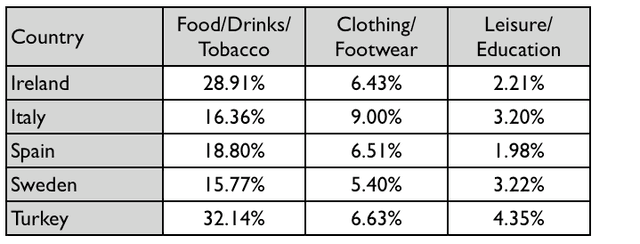
The table illustrates the percentages of consumer expenditure for different categories in five countries in 2002, namely Ireland, Italy, Spain, Sweden, and Turkey.